Newtown, Ohio facts for kids
Quick facts for kids
Newtown, Ohio
|
|
|---|---|
|
Village
|
|

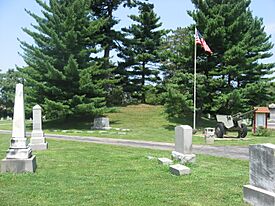
Native American mound in a Newtown cemetery
|
|

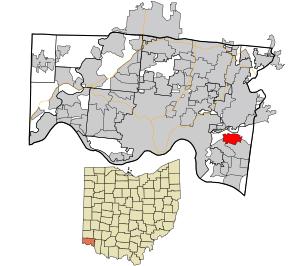
Location in Hamilton County and the state of Ohio
|
|
| Country | United States |
| State | Ohio |
| County | Hamilton |
| Area | |
| • Total | 2.23 sq mi (5.76 km2) |
| • Land | 2.07 sq mi (5.35 km2) |
| • Water | 0.16 sq mi (0.41 km2) |
| Elevation | 512 ft (156 m) |
| Population
(2020)
|
|
| • Total | 2,702 |
| • Density | 1,307.21/sq mi (504.62/km2) |
| Time zone | UTC-5 (Eastern (EST)) |
| • Summer (DST) | UTC-4 (EDT) |
| ZIP code |
45244
|
| Area code(s) | 513 |
| FIPS code | 39-55678 |
| GNIS feature ID | 1086222 |
Newtown is a small village located in southeastern Hamilton County, Ohio, in the United States. It's quite close to the larger city of Cincinnati. In 2020, about 2,702 people lived there. Newtown was first settled way back in 1792 and officially became a village in 1901.
History of Newtown
Long before Newtown was settled, the area was home to Native American communities. These groups built large earth structures, known as earthworks or mounds. Many of these ancient sites were once found where Newtown is today.
Newtown was first settled in 1792 and was originally called Mercersburg. The name was changed to Newtown before it became an official village in 1901. Some of these ancient Native American sites can still be seen today, like the Odd Fellows' Cemetery Mound and the Perin Village Site. There are also other important sites, such as the Turpin site and the Hahn Field Archeological District, just outside the village.
In the 1960s, Newtown became its own separate area, no longer fully part of Anderson Township.
Newtown's Geography
Newtown is completely surrounded by Anderson Township. This is the area it separated from in the 1960s.
The United States Census Bureau reports that the village covers a total area of about 2.37 square miles (6.14 square kilometers). Most of this area, about 2.17 square miles (5.62 square kilometers), is land. The rest, about 0.20 square miles (0.52 square kilometers), is water.
Population of Newtown
| Historical population | |||
|---|---|---|---|
| Census | Pop. | %± | |
| 1880 | 424 | — | |
| 1890 | 552 | 30.2% | |
| 1910 | 546 | — | |
| 1920 | 534 | −2.2% | |
| 1930 | 939 | 75.8% | |
| 1940 | 1,146 | 22.0% | |
| 1950 | 1,462 | 27.6% | |
| 1960 | 1,750 | 19.7% | |
| 1970 | 2,038 | 16.5% | |
| 1980 | 1,817 | −10.8% | |
| 1990 | 1,589 | −12.5% | |
| 2000 | 2,420 | 52.3% | |
| 2010 | 2,672 | 10.4% | |
| 2020 | 2,702 | 1.1% | |
| U.S. Decennial Census | |||
The population of Newtown has changed a lot over the years. In 1880, only 424 people lived there. By 2020, the population had grown to 2,702 people. This means there are about 1,307 people living in every square mile of the village.
In 2020, most of the people living in Newtown were White (88.1%). There were also Black or African American (3.0%), Asian (2.6%), and Native American (0.1%) residents. About 5.2% of the population identified as being from two or more races. Around 3.0% of the people were Hispanic or Latino.
The village has people of all ages. About 25.8% of the population is under 18 years old. Around 51.9% are between 18 and 64, and 22.3% are 65 or older. The average age in Newtown is about 40.9 years old.
Newtown's Culture
Newtown has some fun traditions! One popular event is a fish fry held every Friday during Lent. This event has been going on for decades. It used to be run only by the local volunteer fire department. Now, many volunteers from the community help make it happen.
Newtown also celebrates an annual Winterfest in December. This is a special event that brings the community together during the winter holidays.
See also
In Spanish: Newtown (Ohio) para niños

