Noblejas facts for kids
Quick facts for kids
Noblejas
|
|||
|---|---|---|---|
 |
|||
|
|||
| Country | Spain | ||
| Autonomous community | Castilla–La Mancha | ||
| Province | Toledo | ||
| Area | |||
| • Total | 69.67 km2 (26.90 sq mi) | ||
| • Water | 735 km2 (284 sq mi) | ||
| Population
(2018)
|
|||
| • Total | 3,486 | ||
| • Density | 50.036/km2 (129.592/sq mi) | ||
| Time zone | UTC+1 (CET) | ||
| • Summer (DST) | UTC+2 (CEST) | ||
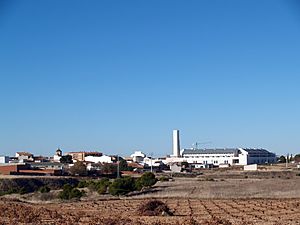
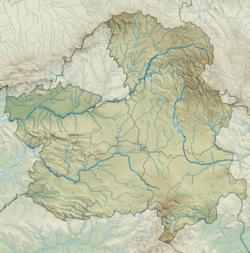
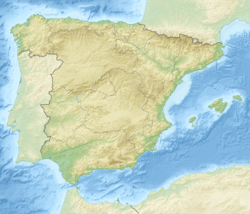
Noblejas is a small town, also called a municipality, located in Spain. It's part of the province of Toledo, which is in the region of Castilla–La Mancha. Think of a province like a big county, and a region like a state!
Noblejas covers an area of about 69.67 square kilometers. That's roughly 27 square miles. As of January 1, 2021, about 3,721 people live there. Just south of Noblejas, you can find the powerful transmitters for Radio Exterior. This is Spain's international shortwave radio station. Noblejas is also part of a traditional area called the comarca of Mesa de Ocaña.
A Look Back at Noblejas's History
Noblejas has a long and interesting past! Imagine going back in time to the year 1149. Back then, Noblejas was just a tiny village, known as a hamlet. It was connected to a larger place called Aurelia, which is now known as Oreja.
By the year 1224, Noblejas had grown a bit. It was then known as a populated place linked to the Order of Santiago. This was a very important group of knights in Spain, similar to a military and religious order. They played a big role in the history of the area. By the early 1400s, Noblejas had grown even more and was officially recognized as a town.
How Noblejas's Population Has Changed
Demographics is the study of how populations change over time. It helps us understand how many people live in a place and how that number goes up or down. Below, you can see how the number of people living in Noblejas has changed over many years.
| Historical population | ||
|---|---|---|
| Year | Pop. | ±% |
| 1900 | 2,809 | — |
| 1910 | 3,127 | +11.3% |
| 1920 | 3,170 | +1.4% |
| 1930 | 3,237 | +2.1% |
| 1940 | 3,136 | −3.1% |
| 1950 | 3,127 | −0.3% |
| 1960 | 2,904 | −7.1% |
| 1970 | 2,825 | −2.7% |
| 1981 | 2,885 | +2.1% |
| 1991 | 2,842 | −1.5% |
| 2001 | 3,063 | +7.8% |
| 2011 | 3,617 | +18.1% |
| 2021 | 3,721 | +2.9% |
| 2023 | 3,911 | +5.1% |
| Source: INE | ||
As you can see from the table, the population of Noblejas has changed quite a bit over the years. Sometimes it grew, and sometimes it got a little smaller. These changes can happen for many reasons, like people moving for jobs or families growing.
See also
 In Spanish: Noblejas para niños
 | Precious Adams |
 | Lauren Anderson |
 | Janet Collins |


