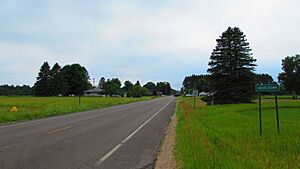
Norwich Township, Missaukee County, Michigan facts for kids
Quick facts for kids
Norwich Township, Michigan
|
|
|---|---|
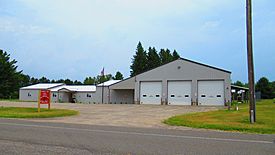
Norwich Township Hall and Fire Department
|
|
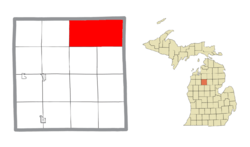
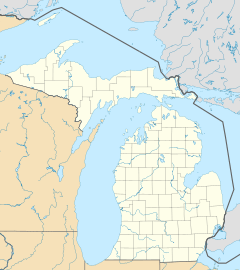
Location within Missaukee County and the state of Michigan
|
|
| Country | United States |
| State | Michigan |
| County | Missaukee |
| Area | |
| • Total | 72.60 sq mi (188.0 km2) |
| • Land | 71.92 sq mi (186.3 km2) |
| • Water | 0.68 sq mi (1.8 km2) |
| Elevation | 1,191 ft (363 m) |
| Population
(2020)
|
|
| • Total | 631 |
| • Density | 8.77/sq mi (3.39/km2) |
| Time zone | UTC-5 (Eastern (EST)) |
| • Summer (DST) | UTC-4 (EDT) |
| ZIP Codes | |
| Area code(s) | 231 |
| FIPS code | 26-113-59280 |
| GNIS feature ID | 1626823 |
Norwich Township is a local government area in Missaukee County, Michigan, USA. It is like a small town or district. In 2020, about 631 people lived here.
Contents
Communities in Norwich Township
Moorestown: A Local Hub
Moorestown is a small community located within Norwich Township. It is not a separate city or town. The main building for the township's local government, called the township hall, is in Moorestown. In the 1920s, an important road called M-74 used to pass through Moorestown.
Geography and Location
Where is Norwich Township?
Norwich Township is in the very top right corner of Missaukee County. To its north is Kalkaska County. To its east is Roscommon County. A small part of Crawford County touches its northeast corner.
Land and Water Area
The township covers a total area of about 72.60 square miles (188.0 square kilometers). Most of this area, about 71.92 square miles (186.3 square kilometers), is land. A small part, about 0.68 square miles (1.8 square kilometers), is water. This means less than 1% of the township is water.
Local Climate Information
The weather in Norwich Township is similar to a nearby weather station called Kalkaska 11SE. This station helps us understand the typical temperatures and rainfall in the area. The area experiences cold winters with lots of snow and warm summers.
| Climate data for Kalkaska 11SE, Michigan, 1991–2020 normals: 1083ft (330m) | |||||||||||||
|---|---|---|---|---|---|---|---|---|---|---|---|---|---|
| Month | Jan | Feb | Mar | Apr | May | Jun | Jul | Aug | Sep | Oct | Nov | Dec | Year |
| Record high °F (°C) | 51 (11) |
59 (15) |
86 (30) |
85 (29) |
93 (34) |
94 (34) |
96 (36) |
96 (36) |
91 (33) |
88 (31) |
74 (23) |
59 (15) |
96 (36) |
| Mean maximum °F (°C) | 43.3 (6.3) |
46.3 (7.9) |
58.5 (14.7) |
75.3 (24.1) |
86.7 (30.4) |
88.5 (31.4) |
90.1 (32.3) |
88.4 (31.3) |
85.4 (29.7) |
75.5 (24.2) |
61.6 (16.4) |
47.7 (8.7) |
91.8 (33.2) |
| Mean daily maximum °F (°C) | 23.9 (−4.5) |
27.4 (−2.6) |
37.4 (3.0) |
51.1 (10.6) |
65.3 (18.5) |
74.0 (23.3) |
76.6 (24.8) |
75.7 (24.3) |
68.2 (20.1) |
54.6 (12.6) |
41.0 (5.0) |
30.2 (−1.0) |
52.1 (11.2) |
| Daily mean °F (°C) | 16.8 (−8.4) |
17.7 (−7.9) |
26.7 (−2.9) |
39.7 (4.3) |
52.6 (11.4) |
61.6 (16.4) |
64.6 (18.1) |
63.9 (17.7) |
55.8 (13.2) |
44.4 (6.9) |
33.2 (0.7) |
23.9 (−4.5) |
41.7 (5.4) |
| Mean daily minimum °F (°C) | 9.8 (−12.3) |
8.0 (−13.3) |
16.0 (−8.9) |
28.3 (−2.1) |
39.8 (4.3) |
49.2 (9.6) |
52.5 (11.4) |
52.1 (11.2) |
43.4 (6.3) |
34.3 (1.3) |
25.3 (−3.7) |
17.6 (−8.0) |
31.4 (−0.4) |
| Mean minimum °F (°C) | −11.9 (−24.4) |
−11.2 (−24.0) |
−8.0 (−22.2) |
12.5 (−10.8) |
24.9 (−3.9) |
33.1 (0.6) |
40.8 (4.9) |
38.7 (3.7) |
31.1 (−0.5) |
22.8 (−5.1) |
11.1 (−11.6) |
0.9 (−17.3) |
−15.1 (−26.2) |
| Record low °F (°C) | −25 (−32) |
−33 (−36) |
−26 (−32) |
−5 (−21) |
18 (−8) |
29 (−2) |
37 (3) |
32 (0) |
26 (−3) |
19 (−7) |
1 (−17) |
−19 (−28) |
−33 (−36) |
| Average precipitation inches (mm) | 2.26 (57) |
1.99 (51) |
2.14 (54) |
3.49 (89) |
3.65 (93) |
3.55 (90) |
3.27 (83) |
3.57 (91) |
3.54 (90) |
3.77 (96) |
3.03 (77) |
2.22 (56) |
36.48 (927) |
| Average snowfall inches (cm) | 28.50 (72.4) |
25.30 (64.3) |
15.40 (39.1) |
9.50 (24.1) |
0.50 (1.3) |
0.00 (0.00) |
0.00 (0.00) |
0.00 (0.00) |
0.00 (0.00) |
2.60 (6.6) |
14.00 (35.6) |
30.50 (77.5) |
126.3 (320.9) |
| Source 1: NOAA | |||||||||||||
| Source 2: XMACIS (records & monthly max/mins) | |||||||||||||
Population and People
How Many People Live Here?
The number of people living in Norwich Township has changed over the years. Here's a quick look at the population from past censuses:
| Historical population | |||
|---|---|---|---|
| Census | Pop. | %± | |
| 1890 | 441 | — | |
| 1900 | 789 | 78.9% | |
| 1910 | 695 | −11.9% | |
| 1920 | 417 | −40.0% | |
| 1930 | 299 | −28.3% | |
| 1940 | 443 | 48.2% | |
| 1950 | 361 | −18.5% | |
| 1960 | 307 | −15.0% | |
| 1970 | 321 | 4.6% | |
| 1980 | 418 | 30.2% | |
| 1990 | 505 | 20.8% | |
| 2000 | 646 | 27.9% | |
| 2010 | 611 | −5.4% | |
| 2020 | 631 | 3.3% | |
| U.S. Decennial Census | |||
In 2000, there were 646 people living in Norwich Township. This meant there were about 9 people for every square mile.
Who Lives in the Township?
In 2000, most people in the township were White (about 97.8%). A small number of people were from other backgrounds, including African American, Native American, and Asian. About 1% of the population was Hispanic or Latino.
There were 258 homes in the township. Many of these homes (about 60.5%) were families with married couples. About 29% of homes had children under 18 living there.
Age Groups in Norwich Township
The population in 2000 was made up of different age groups:
- About 25.5% of people were under 18 years old.
- About 6.3% were between 18 and 24 years old.
- About 24.8% were between 25 and 44 years old.
- About 26.8% were between 45 and 64 years old.
- About 16.6% were 65 years old or older.
The average age in the township was 40 years old.
Income in the Township
In 2000, the average income for a household in Norwich Township was about $27,788 per year. For families, the average income was about $32,045 per year. Some families and individuals had lower incomes. For example, about 18.2% of all people in the township had incomes below what is considered the poverty line at that time. This included about 26.5% of children under 18 and 23% of people aged 65 or older.
See also
 In Spanish: Municipio de Norwich (condado de Missaukee) para niños
 | Sharif Bey |
 | Hale Woodruff |
 | Richmond Barthé |
 | Purvis Young |


