Oak Grove, Illinois facts for kids
Quick facts for kids
Oak Grove
|
|
|---|---|

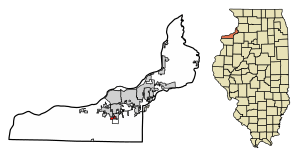
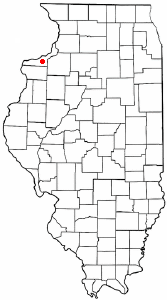
Location of Oak Grove in Rock Island County, Illinois.
|
|

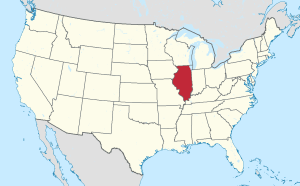
Location of Illinois in the United States
|
|
| Country | United States |
| State | Illinois |
| County | Rock Island |
| Area | |
| • Total | 0.66 sq mi (1.70 km2) |
| • Land | 0.66 sq mi (1.70 km2) |
| • Water | 0.00 sq mi (0.00 km2) |
| Population
(2020)
|
|
| • Total | 476 |
| • Density | 723.40/sq mi (279.33/km2) |
| Time zone | UTC-6 (CST) |
| • Summer (DST) | UTC-5 (CDT) |
| ZIP Code(s) |
XXXXX
|
| Area code(s) | 309 |
| FIPS code | 17-54703 |
| Wikimedia Commons | Oak Grove, Illinois |
Oak Grove is a small village located in Rock Island County, Illinois, United States. It's a quiet place where people live and work.
In 2020, the village had 476 residents. This number was a bit higher than in 2010, when 396 people lived there.
Contents
Where is Oak Grove Located?
Oak Grove is found at specific coordinates: 41.413413 degrees North and -90.569794 degrees West. These numbers help pinpoint its exact spot on a map.
The village covers a total area of about 0.57 square miles (or 1.70 square kilometers). All of this area is land, meaning there are no large lakes or rivers within the village limits.
How Has Oak Grove's Population Changed?
| Historical population | |||
|---|---|---|---|
| Census | Pop. | %± | |
| 1960 | 888 | — | |
| 1970 | 618 | −30.4% | |
| 1980 | 695 | 12.5% | |
| 1990 | 626 | −9.9% | |
| 2000 | 220 | −64.9% | |
| 2010 | 396 | 80.0% | |
| 2020 | 476 | 20.2% | |
| U.S. Decennial Census | |||
The population of Oak Grove has changed quite a bit over the years. For example, in 1960, there were 888 people living there. By 2000, the number dropped to 220. Then, it started to grow again.
It's important to know that the 2000 census count was a bit confusing. It accidentally included people from a nearby correctional center. This center is actually in East Moline, not Oak Grove. So, the real population for Oak Grove in 2000 was 220.
Who Lives in Oak Grove?
This table shows the different groups of people living in Oak Grove over time. The census counts people by their race and ethnicity.
| Race / Ethnicity (NH = Non-Hispanic) | Pop 2000 | Pop 2010 | Pop 2020 | % 2000 | % 2010 | % 2020 |
|---|---|---|---|---|---|---|
| White alone (NH) | 442 | 369 | 414 | 33.54% | 93.18% | 86.97% |
| Black or African American alone (NH) | 761 | 1 | 0 | 57.74% | 0.25% | 0.00% |
| Native American or Alaska Native alone (NH) | 1 | 2 | 0 | 0.08% | 0.51% | 0.00% |
| Asian alone (NH) | 0 | 1 | 5 | 0.00% | 0.25% | 1.05% |
| Pacific Islander alone (NH) | 0 | 0 | 1 | 0.00% | 0.00% | 0.21% |
| Other race alone (NH) | 0 | 0 | 0 | 0.00% | 0.00% | 0.00% |
| Mixed race or Multiracial (NH) | 0 | 5 | 22 | 0.00% | 1.26% | 4.62% |
| Hispanic or Latino (any race) | 114 | 18 | 34 | 8.65% | 4.55% | 7.14% |
| Total | 1,318 | 396 | 476 | 100.00% | 100.00% | 100.00% |
In 2000, there were 109 households in Oak Grove. A household is a group of people living together. About 24% of these households had children under 18.
The average age of people in Oak Grove in 2000 was 34 years old. This means half the people were younger than 34, and half were older.
See also
 In Spanish: Oak Grove (Illinois) para niños
 | Chris Smalls |
 | Fred Hampton |
 | Ralph Abernathy |


