Oakbrook, Kentucky facts for kids
Quick facts for kids
Oakbrook, Kentucky
|
|
|---|---|

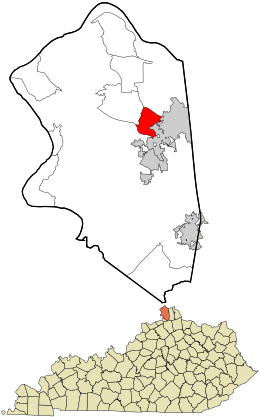
Location within Boone County and the state of Kentucky
|
|
| Country | United States |
| State | Kentucky |
| County | Boone |
| Area | |
| • Total | 3.20 sq mi (8.29 km2) |
| • Land | 3.20 sq mi (8.28 km2) |
| • Water | 0.00 sq mi (0.01 km2) |
| Elevation | 899 ft (274 m) |
| Population
(2020)
|
|
| • Total | 9,268 |
| • Density | 2,898.06/sq mi (1,118.87/km2) |
| Time zone | UTC-5 (Eastern (EST)) |
| • Summer (DST) | UTC-4 (EDT) |
| FIPS code | 21-57030 |
| GNIS feature ID | 2403365 |
Oakbrook is a community in Boone County, Kentucky, in the United States. It's called a "census-designated place" (CDP) because it's a special area defined for gathering census information, even though it's not an official city or town. In 2020, about 9,268 people lived there.
Contents
Where is Oakbrook Located?
Oakbrook is in the eastern part of Boone County. It shares its borders with the city of Florence to the east and south. To the west, you'll find the community of Burlington, which is the county seat.
Kentucky Route 18 (also known as Burlington Pike) runs along the northern edge of the Oakbrook area. Major highways like Interstate 75 and 71 are only about half a mile east of Oakbrook. If you travel about 12 miles northeast, you'll reach downtown Cincinnati.
Land and Water Area
The United States Census Bureau reports that Oakbrook covers a total area of about 3.2 square miles (8.2 square kilometers). Most of this area is land. Only a very small part, about 0.004 square miles (0.01 square kilometers), is water.
Who Lives in Oakbrook?
| Historical population | |||
|---|---|---|---|
| Census | Pop. | %± | |
| 2020 | 9,268 | — | |
| U.S. Decennial Census | |||
Let's look at the people who live in Oakbrook. According to the census from 2000, there were 7,726 people living there. These people made up 2,926 households and 2,206 families.
Population Details
The population density in 2000 was about 2,369 people per square mile (915 people per square kilometer). There were also 3,030 housing units, which are places where people live.
Most of the people in Oakbrook were White (about 94.81%). There were also smaller percentages of African American (1.84%), Asian (2.10%), and Native American (0.10%) residents. About 1.06% of the population identified as Hispanic or Latino.
Households and Families
In 2000, about 38.7% of the households in Oakbrook had children under 18 living with them. Most households (67.2%) were married couples living together. About 20.8% of all households were made up of people living alone. The average household had 2.64 people, and the average family had 3.10 people.
Age Groups
The population in Oakbrook was spread out across different age groups:
- About 27.9% were under 18 years old.
- About 6.4% were between 18 and 24 years old.
- The largest group, 36.0%, was between 25 and 44 years old.
- About 22.8% were between 45 and 64 years old.
- About 7.0% were 65 years old or older.
The average age of people in Oakbrook was 34 years. For every 100 females, there were about 97.4 males.
Income Information
In 2000, the average income for a household in Oakbrook was $62,023. For families, the average income was $72,083. The average income per person in Oakbrook was $27,575. A very small number of families (1.2%) and individuals (1.1%) lived below the poverty line.
See also
 In Spanish: Oakbrook (Kentucky) para niños
 | Bayard Rustin |
 | Jeannette Carter |
 | Jeremiah A. Brown |

