Plumville, Pennsylvania facts for kids
Quick facts for kids
Plumville, Pennsylvania
|
|
|---|---|
|
Borough
|
|

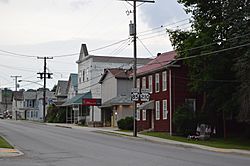
Main Street
|
|

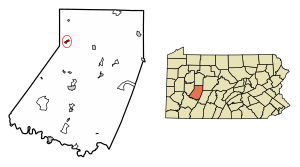
Location of Plumville in Indiana County, Pennsylvania.
|
|
| Country | United States |
| State | Pennsylvania |
| County | Indiana |
| Government | |
| • Type | Borough Council |
| Area | |
| • Total | 0.50 sq mi (1.28 km2) |
| • Land | 0.50 sq mi (1.28 km2) |
| • Water | 0.00 sq mi (0.00 km2) |
| Population
(2020)
|
|
| • Total | 255 |
| • Density | 514.11/sq mi (198.64/km2) |
| Time zone | UTC-5 (Eastern (EST)) |
| • Summer (DST) | UTC-4 (EDT) |
| Zip code |
16246
|
| FIPS code | 42-61632 |
Plumville is a small town, also known as a borough, located in Indiana County, Pennsylvania, United States. In 2020, about 257 people lived there.
Contents
What's in a Name? The Story of Plumville
Plumville got its name because of the many wild plum trees that grew in the area a long time ago. Imagine a place filled with delicious plums!
Where is Plumville? The Geography
Plumville is located at specific coordinates: 40.793823 degrees North and -79.180235 degrees West.
The borough covers a total area of about 0.5 square miles (1.28 square kilometers), and all of it is land. A part of Plum Creek flows through Plumville. There's even a bridge over the creek that was built way back in 1918!
Plumville's Past: A Look at History
Plumville was founded in 1818. This information comes from a local historical marker. An old map from 1856 shows Plumville as a small community. It was part of South Mahoning Township back then.
Telephone service came to Plumville around 1890. This made it easier for people to talk to each other over long distances. Plumville officially became a borough in December 1909. By 1910, the town had a population of 414 people.
There was once a coal mine in the area called the Consolidated Coal and Coke Company's Plumville mine. Today, experts have found areas underground that were mined.
Who Lives in Plumville? Population Facts
| Historical population | |||
|---|---|---|---|
| Census | Pop. | %± | |
| 1880 | 191 | — | |
| 1910 | 414 | — | |
| 1920 | 538 | 30.0% | |
| 1930 | 518 | −3.7% | |
| 1940 | 469 | −9.5% | |
| 1950 | 452 | −3.6% | |
| 1960 | 401 | −11.3% | |
| 1970 | 429 | 7.0% | |
| 1980 | 431 | 0.5% | |
| 1990 | 390 | −9.5% | |
| 2000 | 342 | −12.3% | |
| 2010 | 307 | −10.2% | |
| 2020 | 257 | −16.3% | |
| 2021 (est.) | 256 | −16.6% | |
| Sources: | |||
In the year 2000, there were 342 people living in Plumville. These people lived in 123 households, and 92 of those were families. Most people living in Plumville were White (98.54%).
About 34.1% of the households had children under 18 living with them. The average household had about 2.78 people. The average family had about 3.23 people.
The population was spread out by age:
- 28.9% were under 18 years old.
- 8.5% were between 18 and 24 years old.
- 28.7% were between 25 and 44 years old.
- 21.6% were between 45 and 64 years old.
- 12.3% were 65 years or older.
The average age in Plumville was 33 years.
The median income for a household in Plumville was $26,964. This means half of the households earned more than this, and half earned less. About 29.5% of all people in Plumville lived below the poverty line. This included 44.9% of children under 18.
See also

- In Spanish: Plumville para niños
 | Jackie Robinson |
 | Jack Johnson |
 | Althea Gibson |
 | Arthur Ashe |
 | Muhammad Ali |


