Polebridge, Montana facts for kids
Quick facts for kids
Polebridge, Montana
|
|
|---|---|

Polebridge
|
|
| Country | United States |
| State | Montana |
| County | Flathead |
| Area | |
| • Total | 0.12 sq mi (0.31 km2) |
| • Land | 0.12 sq mi (0.30 km2) |
| • Water | 0.00 sq mi (0.00 km2) |
| Population
(2020)
|
|
| • Total | 14 |
| • Density | 119.66/sq mi (46.25/km2) |
| FIPS code | 30-58675 |
| GNIS feature ID | 789068 |
Polebridge is a small, quiet community in Flathead County, Montana, in the United States. It is an unincorporated community, meaning it does not have its own local government. Polebridge is located about 35 miles (56 km) northwest of Columbia Falls. It sits in the northwestern part of Montana, very close to the Canada–United States border.
This unique place got its name in 1920. It was named after a log bridge that used to connect two roads. This bridge crossed the North Fork Flathead River. One road was inside Glacier National Park, and the other led to Montana Secondary Highway 486.
Life in Polebridge
Polebridge offers a very different way of life compared to most places. Residents here do not have electricity. This means no TVs, computers, or modern lights. For lighting at night, people use candles or old-fashioned oil lamps. There are also no regular phone lines or internet services. People mostly communicate through mail.
The population of Polebridge changes a lot throughout the year. From May through October, when the weather is warmer, nearly 100 people live there. But during the colder months, the population drops to just a few people. This is because there are no modern heating systems. People rely on woodstoves or coal stoves to stay warm.
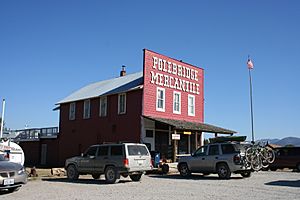
The Polebridge Mercantile
A very important part of Polebridge is the Polebridge Mercantile. This historic store has been open since 1914. It is part of the W.L. Adair General Mercantile Historic District, which is listed on the National Register of Historic Places. The store is usually open from May through October, serving both residents and visitors.
Climate in Polebridge
Polebridge experiences a wide range of weather throughout the year. Summers are generally warm, while winters can be very cold. The area receives a good amount of precipitation, including snow in the winter months.
Population Details
Polebridge is a very small community. According to the 2020 United States Census, only 14 people live there permanently. This makes it one of the least populated places in Montana.
 | Delilah Pierce |
 | Gordon Parks |
 | Augusta Savage |
 | Charles Ethan Porter |

