Putnam, Texas facts for kids
Quick facts for kids
Putnam, Texas
|
|
|---|---|

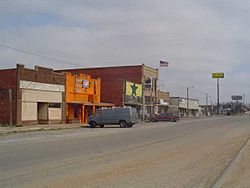
Downtown Putnam
|
|

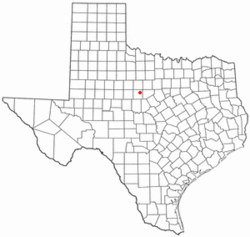
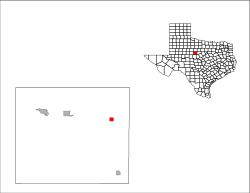
Location of Putnam, Texas
|
|
 |
|
| Country | United States |
| State | Texas |
| County | Callahan |
| Area | |
| • Total | 1.01 sq mi (2.62 km2) |
| • Land | 1.01 sq mi (2.62 km2) |
| • Water | 0.00 sq mi (0.00 km2) |
| Elevation | 1,601 ft (488 m) |
| Population
(2020)
|
|
| • Total | 63 |
| • Density | 62.38/sq mi (24.05/km2) |
| Time zone | UTC-6 (Central (CST)) |
| • Summer (DST) | UTC-5 (CDT) |
| ZIP code |
76469
|
| Area code(s) | 325 |
| FIPS code | 48-59984 |
| GNIS feature ID | 2412513 |
Putnam is a small town located in Callahan County, Texas, in the United States. In 2020, about 63 people lived there. This number was a bit lower than the 94 people who lived there in 2010. Putnam is part of the larger Abilene area.
Contents
Exploring Putnam's Location
Putnam is found in the northeastern part of Callahan County. A major highway, Interstate 20, goes right through the town. If you travel west on this highway for about 12 miles, you will reach Baird. Baird is the main town, or county seat, of Callahan County. Traveling east on the same highway for 12 miles will take you to Cisco.
The town of Putnam covers an area of about 1.0 square mile (2.6 square kilometers). All of this area is land, with no large bodies of water.
Understanding Putnam's Weather
The weather in Putnam usually has hot summers. The winters are generally mild, meaning not too cold. This type of weather is known as a humid subtropical climate. On climate maps, you might see it marked as "Cfa". This means it's often warm and humid, especially in summer.
| Climate data for Putnam, Texas (1991–2020 normals, extremes 1963–present) | |||||||||||||
|---|---|---|---|---|---|---|---|---|---|---|---|---|---|
| Month | Jan | Feb | Mar | Apr | May | Jun | Jul | Aug | Sep | Oct | Nov | Dec | Year |
| Record high °F (°C) | 89 (32) |
96 (36) |
97 (36) |
102 (39) |
109 (43) |
110 (43) |
109 (43) |
111 (44) |
109 (43) |
101 (38) |
93 (34) |
90 (32) |
111 (44) |
| Mean maximum °F (°C) | 79.0 (26.1) |
83.3 (28.5) |
88.2 (31.2) |
93.5 (34.2) |
97.7 (36.5) |
99.7 (37.6) |
103.1 (39.5) |
103.0 (39.4) |
98.8 (37.1) |
93.1 (33.9) |
84.3 (29.1) |
79.2 (26.2) |
105.2 (40.7) |
| Mean daily maximum °F (°C) | 57.3 (14.1) |
61.0 (16.1) |
69.0 (20.6) |
77.5 (25.3) |
84.4 (29.1) |
91.1 (32.8) |
95.5 (35.3) |
95.6 (35.3) |
88.1 (31.2) |
78.4 (25.8) |
66.9 (19.4) |
58.2 (14.6) |
76.9 (24.9) |
| Daily mean °F (°C) | 44.6 (7.0) |
48.0 (8.9) |
55.9 (13.3) |
64.1 (17.8) |
72.3 (22.4) |
79.8 (26.6) |
83.7 (28.7) |
83.4 (28.6) |
75.9 (24.4) |
65.7 (18.7) |
54.4 (12.4) |
46.0 (7.8) |
64.5 (18.1) |
| Mean daily minimum °F (°C) | 32.0 (0.0) |
35.1 (1.7) |
42.7 (5.9) |
50.7 (10.4) |
60.1 (15.6) |
68.5 (20.3) |
71.9 (22.2) |
71.3 (21.8) |
63.8 (17.7) |
53.0 (11.7) |
41.9 (5.5) |
33.8 (1.0) |
52.1 (11.2) |
| Mean minimum °F (°C) | 16.5 (−8.6) |
19.6 (−6.9) |
24.4 (−4.2) |
33.8 (1.0) |
45.0 (7.2) |
57.6 (14.2) |
65.2 (18.4) |
62.3 (16.8) |
49.2 (9.6) |
34.9 (1.6) |
24.8 (−4.0) |
18.1 (−7.7) |
12.7 (−10.7) |
| Record low °F (°C) | 0 (−18) |
−7 (−22) |
6 (−14) |
25 (−4) |
34 (1) |
45 (7) |
56 (13) |
52 (11) |
37 (3) |
20 (−7) |
16 (−9) |
−8 (−22) |
−8 (−22) |
| Average precipitation inches (mm) | 1.20 (30) |
1.77 (45) |
2.23 (57) |
2.08 (53) |
3.89 (99) |
3.66 (93) |
2.36 (60) |
2.42 (61) |
2.92 (74) |
2.87 (73) |
2.15 (55) |
1.43 (36) |
28.98 (736) |
| Average snowfall inches (cm) | 0.7 (1.8) |
1.0 (2.5) |
0.2 (0.51) |
0.2 (0.51) |
0.0 (0.0) |
0.0 (0.0) |
0.0 (0.0) |
0.0 (0.0) |
0.0 (0.0) |
0.0 (0.0) |
0.6 (1.5) |
1.1 (2.8) |
3.8 (9.7) |
| Average precipitation days (≥ 0.01 in) | 4.3 | 4.6 | 5.3 | 4.9 | 7.5 | 6.2 | 4.6 | 5.6 | 5.2 | 5.4 | 4.5 | 4.3 | 62.4 |
| Average snowy days (≥ 0.1 in) | 0.5 | 0.8 | 0.1 | 0.1 | 0.0 | 0.0 | 0.0 | 0.0 | 0.0 | 0.0 | 0.3 | 0.5 | 2.3 |
| Source: NOAA | |||||||||||||
Population Changes Over Time
The number of people living in Putnam has changed quite a bit over the years. In 1930, there were over 600 residents. However, the population has slowly decreased since then. By 2020, it was down to 63 people.
| Historical population | |||
|---|---|---|---|
| Census | Pop. | %± | |
| 1930 | 601 | — | |
| 1940 | 487 | −19.0% | |
| 1950 | 289 | −40.7% | |
| 1960 | 203 | −29.8% | |
| 1970 | 134 | −34.0% | |
| 1980 | 116 | −13.4% | |
| 1990 | 103 | −11.2% | |
| 2000 | 88 | −14.6% | |
| 2010 | 94 | 6.8% | |
| 2020 | 63 | −33.0% | |
| U.S. Decennial Census | |||
Who Lives in Putnam?
The 2020 United States census showed that 63 people lived in Putnam. These people made up 41 households, and 26 of these were families. Most of the people living in Putnam were White (Non-Hispanic). A small percentage were Hispanic or Latino.
| Race | Number | Percentage |
|---|---|---|
| White (NH) | 61 | 96.83% |
| Hispanic or Latino | 2 | 3.17% |
| Total | 63 |
Education for Putnam Students
Students who live in Putnam attend schools that are part of the Baird Independent School District. This school district serves the educational needs of the community.
Famous People from Putnam
- Stan Williams was an American football player who came from Putnam.
See also
 In Spanish: Putnam (Texas) para niños

