
Smith Mills, Massachusetts facts for kids
Quick facts for kids
Smith Mills, Massachusetts
|
|
|---|---|

Smith Mills Congregational Church
|
|

Location in Bristol County in Massachusetts
|
|
| Country | United States |
| State | Massachusetts |
| County | Bristol |
| Town | Dartmouth |
| Area | |
| • Total | 4.75 sq mi (12.30 km2) |
| • Land | 4.67 sq mi (12.09 km2) |
| • Water | 0.08 sq mi (0.21 km2) |
| Elevation | 69 ft (21 m) |
| Population
(2020)
|
|
| • Total | 4,832 |
| • Density | 1,035.13/sq mi (399.68/km2) |
| Time zone | UTC-5 (Eastern (EST)) |
| • Summer (DST) | UTC-4 (EDT) |
| FIPS code | 25-62300 |
| GNIS feature ID | 0613755 |
Smith Mills is a special kind of community called a census-designated place (CDP). It is located in the town of Dartmouth, which is part of Bristol County in Massachusetts, United States. In 2020, about 4,832 people lived in Smith Mills.
Contents
Exploring Smith Mills' Location
Smith Mills is found at a specific spot on the map, known as its coordinates: 41.639807 degrees North and 70.984491 degrees West. These numbers help pinpoint its exact location in the world.
Land and Water Area
This community covers a total area of about 12.3 square kilometers (or 4.75 square miles). Most of this area is land, measuring around 12.09 square kilometers (4.67 square miles). A small part, about 0.21 square kilometers (0.08 square miles), is covered by water.
Who Lives in Smith Mills?
| Historical population | |||
|---|---|---|---|
| Census | Pop. | %± | |
| 2020 | 4,832 | — | |
| U.S. Decennial Census | |||
In 2000, there were 4,432 people living in Smith Mills. These people made up 1,861 households, with 1,269 of them being families. The area had about 361.8 people per square kilometer.
Community Makeup
Most people in Smith Mills identified as White (95.62%). There were also smaller groups of people identifying as African American, Native American, and Asian. About 1.33% of the population identified as Hispanic or Latino.
Households and Families
Out of all the households, about 27.2% had children under 18 living there. Many households (49.9%) were married couples living together. About 15.3% of households were led by a female without a husband present.
Age Groups in Smith Mills
The population in Smith Mills was spread out by age:
- 21.0% were under 18 years old.
- 7.4% were between 18 and 24 years old.
- 24.3% were between 25 and 44 years old.
- 25.2% were between 45 and 64 years old.
- 22.1% were 65 years or older.
The average age of people in Smith Mills was 43 years.
Income and Economy
In 2000, the average income for a household in Smith Mills was $41,272 per year. For families, the average income was $50,558. The average income per person in the community was $20,820. A small number of families (6.6%) and individuals (6.4%) lived below the poverty line.
Images for kids
-
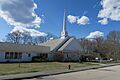
Smith Mills Congregational Church
-
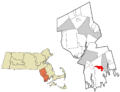
Location in Bristol County in Massachusetts
See also
 In Spanish: Smith Mills para niños
