South Lebanon, Ohio facts for kids
Quick facts for kids
South Lebanon, Ohio
|
|
|---|---|
|
City
|
|
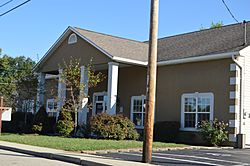
City Hall
|
|
| Motto(s):
"Reclaiming Our Past Embracing Our Future"
|
|
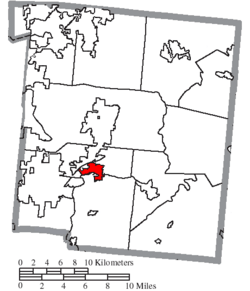
Location of South Lebanon in Warren County
|
|
| Country | United States |
| State | Ohio |
| County | Warren |
| Government | |
| • Type | Mayor–council |
| Area | |
| • Total | 3.55 sq mi (9.21 km2) |
| • Land | 3.43 sq mi (8.88 km2) |
| • Water | 0.13 sq mi (0.32 km2) |
| Elevation | 627 ft (191 m) |
| Population
(2020)
|
|
| • Total | 6,384 |
| • Density | 1,861.77/sq mi (718.84/km2) |
| Time zone | UTC-5 (Eastern (EST)) |
| • Summer (DST) | UTC-4 (EDT) |
| ZIP code |
45065
|
| Area code(s) | 513 |
| FIPS code | 39-73446 |
| GNIS feature ID | 2399851 |
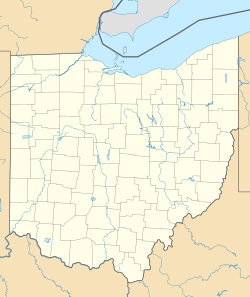
South Lebanon is a city in Ohio, located in Warren County. It is found in the southwestern part of the state. In 2020, about 6,384 people lived there. The city is part of both Union and Hamilton Townships.
Contents
Discovering South Lebanon's Past
The first people settled in the area of South Lebanon in the 1790s. The village was first called "Deerfield." This name came from Deerfield Township, where it was the main settlement.
Why the Name Changed
The village's name was changed because it was very close to Lebanon, which is the county seat. When a railroad was built through the area, the new name "South Lebanon" was chosen. A post office opened in 1828 under the name Deerfield Village. Its name was officially changed to South Lebanon in 1871.
Exploring South Lebanon's Geography
South Lebanon covers a total area of about 2.68 square miles (6.94 square kilometers). Most of this area, about 2.65 square miles (6.86 square kilometers), is land. A smaller part, about 0.03 square miles (0.08 square kilometers), is water.
Understanding South Lebanon's Population
The population of South Lebanon has changed a lot over the years. Here's how the number of people living there has grown:
| Historical population | |||
|---|---|---|---|
| Census | Pop. | %± | |
| 1880 | 42 | — | |
| 1900 | 484 | — | |
| 1910 | 626 | 29.3% | |
| 1920 | 675 | 7.8% | |
| 1930 | 713 | 5.6% | |
| 1940 | 756 | 6.0% | |
| 1950 | 1,291 | 70.8% | |
| 1960 | 2,720 | 110.7% | |
| 1970 | 3,014 | 10.8% | |
| 1980 | 2,700 | −10.4% | |
| 1990 | 2,696 | −0.1% | |
| 2000 | 2,538 | −5.9% | |
| 2010 | 4,115 | 62.1% | |
| 2020 | 6,384 | 55.1% | |
| U.S. Decennial Census | |||
Local School Districts
Most of South Lebanon is part of the Kings Local School District. However, some parts of the city are in the Little Miami Local School District and the Lebanon City School District. The entire city uses the South Lebanon telephone exchange.
A Look at the 2010 Population
In 2010, there were 4,115 people living in South Lebanon. There were 1,533 households, which are groups of people living together in one home. The average number of people in each household was about 2.67.
The average age of people in the village was 35.3 years old. About 28.9% of the residents were under 18 years old. About 9% of the residents were 65 years old or older.
See also
 In Spanish: South Lebanon (Ohio) para niños
 | Leon Lynch |
 | Milton P. Webster |
 | Ferdinand Smith |


