South Taranaki District facts for kids
Quick facts for kids
South Taranaki District
|
|
|---|---|
|
Territorial authority district
|
|

Hāwera
|
|

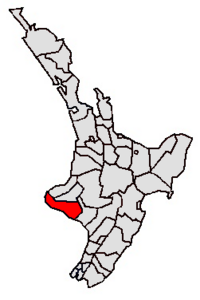
Location of the South Taranaki District in North Island
|
|
| Country | New Zealand |
| Region | Taranaki |
| Wards |
|
| Area | |
| • Land | 3,575.08 km2 (1,380.35 sq mi) |
| Population
(June 2023)
|
|
| • Total | 29,600 |
| Time zone | UTC+12 (NZST) |
| • Summer (DST) | UTC+13 (NZDT) |
| Postcode(s) |
Map of postcodes
|
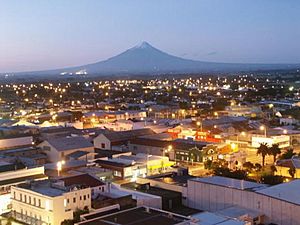
South Taranaki is a district located on the west coast of New Zealand's North Island. It's a special type of local government area called a territorial authority. The main town in the district is Hāwera.
Other towns you can find in South Taranaki include Manaia, Ōpunake, Patea, Eltham, and Waverley. The district is quite large, covering about 3,575 square kilometers (1,380 square miles). It is part of the bigger Taranaki Region.
Did you know that the district sits on the border between two old provinces? This means that towns like Waverley celebrate Wellington Anniversary Day in January. But just 15 kilometers away, Patea celebrates Taranaki Anniversary Day in March!
The local council provides many services for the community. These include several libraries called South Taranaki LibraryPlus branches. You can find these libraries in Manaia, Kaponga, Patea, Eltham, Opunake, Hāwera, and Waverley.
Contents
History of South Taranaki
How the District Was Formed
The South Taranaki District was created in 1989. This happened during a big change in how local governments were organized in New Zealand. Several smaller areas, like Egmont, Eltham, Hawera, Patea, and Waimate West counties, joined together to form this larger district.
People and Population
Who Lives in South Taranaki?
The South Taranaki District covers about 3,575 square kilometers. As of 2023, about 29,025 people live here. This means there are about 8 people living in each square kilometer.
The population has been growing steadily.
- In 2006, there were 26,487 people.
- By 2013, it was 26,580 people.
- In 2018, the number grew to 27,534.
- And in 2023, it reached 29,025 people.
This shows an increase of about 5.4% since 2018.
Age Groups in the District
The median age in South Taranaki is about 39.6 years old. This is a bit older than the national median age of 38.1 years.
Here's a breakdown of age groups from the 2023 census:
- About 21.3% of people are under 15 years old.
- Around 16.6% are between 15 and 29 years old.
- The largest group, about 44.5%, are aged 30 to 64.
- About 17.6% of the population is 65 years or older.
Different Backgrounds and Cultures
South Taranaki is home to people from many different backgrounds.
- About 80.2% of people identify as European or Pākehā.
- Around 29.3% identify as Māori.
- About 3.0% are Pasifika.
- Roughly 4.0% are Asian.
- A small percentage, 0.4%, are from the Middle East, Latin America, or Africa.
- And 1.3% identify with other ethnicities.
It's important to remember that people can identify with more than one ethnicity!
Where People Come From
In 2018, about 8.9% of the people living in South Taranaki were born overseas. This is lower than the national average for New Zealand, which was 27.1% at that time.
Beliefs and Religions
When asked about their religious beliefs in the census:
- 51.0% said they had no religion.
- 35.8% identified as Christian.
- 1.9% followed Māori religious beliefs.
- Smaller numbers identified as Hindu (0.7%), Muslim (0.3%), or Buddhist (0.3%).
- 1.4% had other religions.
Education and Work
Let's look at education and jobs for people aged 15 and older:
- About 9.4% of people had a bachelor's degree or a higher qualification.
- Around 28.9% did not have any formal qualifications.
The average income in South Taranaki was about $28,800. This was a bit lower than the national average of $31,800.
When it comes to jobs:
- About 48.8% of people worked full-time.
- Around 14.3% worked part-time.
- About 4.4% were unemployed.
Wards of South Taranaki
The South Taranaki District is divided into smaller areas called wards. Each ward has its own population and characteristics. Here's a quick look at them from 2018:
| Name | Area (km2) | Population | Density (per km2) | Households | Median age | Median income |
|---|---|---|---|---|---|---|
| Egmont Plains Ward | 860.42 | 6,345 | 7.37 | 2,412 | 36.4 years | $29,900 |
| Eltham Ward | 538.17 | 4,029 | 26.07 | 1,557 | 37.2 years | $28,000 |
| Tangahoe Ward | 491.32 | 2,859 | 5.82 | 1,053 | 38.2 years | $40,100 |
| Hawera-Normanby Ward | 17.27 | 10,413 | 602.95 | 4,011 | 38.8 years | $27,900 |
| Patea Ward | 1,667.96 | 3,891 | 2.33 | 1,635 | 43.2 years | $24,000 |
| New Zealand | 37.4 years | $31,800 |
 | Sharif Bey |
 | Hale Woodruff |
 | Richmond Barthé |
 | Purvis Young |

