
St. Mary, Montana facts for kids
Quick facts for kids
St. Mary, Montana
|
|
|---|---|

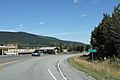
Downtown St. Mary looking north on U.S. Route 89
|
|
| Country | United States |
| State | Montana |
| County | Glacier |
| Area | |
| • Total | 0.75 sq mi (1.95 km2) |
| • Land | 0.75 sq mi (1.95 km2) |
| • Water | 0.00 sq mi (0.00 km2) |
| Population
(2020)
|
|
| • Total | 54 |
| • Density | 71.71/sq mi (27.71/km2) |
| FIPS code | 30-65425 |
St. Mary is a small community in Montana, United States. It's right next to Glacier National Park and borders the Blackfeet Indian Reservation. In the Blackfeet language, its name is Natoaki, which means "Holy Woman."
This village is super important because it's the eastern end of the famous Going-to-the-Sun Road. This beautiful road goes all the way through Glacier National Park for about 53 miles (85 kilometers).
Contents
About St. Mary
St. Mary is officially called an "unincorporated community." This means it's a small place that doesn't have its own local government like a city or town. Instead, it's managed by the county.
The village is located between Saint Mary Lake inside Glacier National Park and Lower St. Mary Lake on the Blackfeet Indian Reservation. U.S. Route 89 also passes right through the village.
People and Visitors
Only about 54 people live in St. Mary all year round. But guess what? In the busy summer months, when lots of tourists visit Glacier National Park, the population can grow ten times bigger!
Even though it's small, St. Mary has many things for visitors. You can find several places to stay, like lodges, restaurants, and cafés. There's also a small grocery store, two gas stations, and campgrounds.
Right next to the village, but inside the park, is a large area where National Park Service workers live.
St. Mary's Population
The number of people living in a place is called its population or demographics. Here's how St. Mary's population has been counted:
| Historical population | |||
|---|---|---|---|
| Census | Pop. | %± | |
| 2020 | 54 | — | |
| U.S. Decennial Census | |||
Weather in St. Mary
St. Mary has a type of weather called a humid continental climate. This means it has big differences in temperature between seasons. Summers are usually warm to hot and can be humid. Winters are cold, and sometimes very cold.
You can see more details about the weather in the table below:
| Climate data for St Mary, Montana, 1991–2020 normals, 1981-2020 extremes: 4560ft (1340m) | |||||||||||||
|---|---|---|---|---|---|---|---|---|---|---|---|---|---|
| Month | Jan | Feb | Mar | Apr | May | Jun | Jul | Aug | Sep | Oct | Nov | Dec | Year |
| Record high °F (°C) | 60 (16) |
63 (17) |
72 (22) |
82 (28) |
93 (34) |
95 (35) |
102 (39) |
99 (37) |
97 (36) |
87 (31) |
72 (22) |
58 (14) |
102 (39) |
| Mean maximum °F (°C) | 51.2 (10.7) |
52.7 (11.5) |
57.3 (14.1) |
68.5 (20.3) |
78.2 (25.7) |
84.8 (29.3) |
91.3 (32.9) |
91.2 (32.9) |
86.0 (30.0) |
73.7 (23.2) |
58.4 (14.7) |
48.8 (9.3) |
93.4 (34.1) |
| Mean daily maximum °F (°C) | 29.2 (−1.6) |
32.1 (0.1) |
37.9 (3.3) |
46.6 (8.1) |
57.2 (14.0) |
64.4 (18.0) |
75.0 (23.9) |
74.4 (23.6) |
63.2 (17.3) |
48.9 (9.4) |
36.3 (2.4) |
29.4 (−1.4) |
49.5 (9.8) |
| Daily mean °F (°C) | 20.8 (−6.2) |
22.9 (−5.1) |
28.7 (−1.8) |
36.5 (2.5) |
45.9 (7.7) |
52.5 (11.4) |
60.6 (15.9) |
59.3 (15.2) |
50.6 (10.3) |
39.9 (4.4) |
29.4 (−1.4) |
22.4 (−5.3) |
39.1 (4.0) |
| Mean daily minimum °F (°C) | 12.3 (−10.9) |
13.7 (−10.2) |
19.6 (−6.9) |
26.3 (−3.2) |
34.6 (1.4) |
40.7 (4.8) |
46.1 (7.8) |
44.2 (6.8) |
37.9 (3.3) |
30.8 (−0.7) |
22.4 (−5.3) |
15.3 (−9.3) |
28.7 (−1.9) |
| Mean minimum °F (°C) | −16.9 (−27.2) |
−10.1 (−23.4) |
−4.3 (−20.2) |
9.6 (−12.4) |
22.3 (−5.4) |
30.9 (−0.6) |
36.9 (2.7) |
33.4 (0.8) |
25.6 (−3.6) |
13.2 (−10.4) |
−1.1 (−18.4) |
−12.6 (−24.8) |
−25.0 (−31.7) |
| Record low °F (°C) | −36 (−38) |
−40 (−40) |
−29 (−34) |
−11 (−24) |
15 (−9) |
27 (−3) |
29 (−2) |
20 (−7) |
12 (−11) |
−8 (−22) |
−24 (−31) |
−38 (−39) |
−40 (−40) |
| Average precipitation inches (mm) | 2.20 (56) |
1.95 (50) |
1.69 (43) |
1.93 (49) |
2.88 (73) |
3.37 (86) |
1.53 (39) |
1.63 (41) |
2.18 (55) |
2.05 (52) |
2.47 (63) |
2.21 (56) |
26.09 (663) |
| Average snowfall inches (cm) | 15.5 (39) |
18.6 (47) |
15.9 (40) |
13.2 (34) |
4.8 (12) |
1.0 (2.5) |
0.0 (0.0) |
0.0 (0.0) |
1.7 (4.3) |
8.5 (22) |
17.8 (45) |
20.8 (53) |
117.8 (298.8) |
| Average extreme snow depth inches (cm) | 12.8 (33) |
13.0 (33) |
11.6 (29) |
7.1 (18) |
2.7 (6.9) |
0.6 (1.5) |
0.0 (0.0) |
0.0 (0.0) |
0.2 (0.51) |
3.3 (8.4) |
8.8 (22) |
9.7 (25) |
20.4 (52) |
| Source 1: NOAA (1981-2010 precip/snowfall) | |||||||||||||
| Source 2: XMACIS2 (records, monthly max/mins & 1981-2010 snow depth) | |||||||||||||
Images for kids
-
Looking north at the sign for St. Mary
-
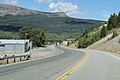
Panorama for St. Mary
-
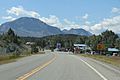
Looking south at St. Mary's sign


