Surrency, Georgia facts for kids
Quick facts for kids
Surrency, Georgia
|
|
|---|---|

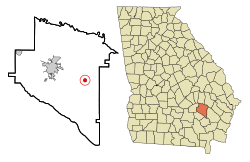
Location in Appling County and the state of Georgia
|
|
| Country | United States |
| State | Georgia |
| County | Appling |
| Area | |
| • Total | 0.78 sq mi (2.01 km2) |
| • Land | 0.77 sq mi (2.00 km2) |
| • Water | 0.00 sq mi (0.00 km2) |
| Elevation | 184 ft (56 m) |
| Population
(2020)
|
|
| • Total | 194 |
| • Density | 250.97/sq mi (96.91/km2) |
| Time zone | UTC-5 (Eastern (EST)) |
| • Summer (DST) | UTC-4 (EDT) |
| ZIP code |
31563
|
| Area code(s) | 912 |
| FIPS code | 13-74852 |
| GNIS feature ID | 0333168 |
Surrency is a small town located in Appling County, Georgia, in the United States. In 2020, about 194 people lived there.
Contents
History of Surrency
Surrency became an official town in 1911. This happened when the Georgia General Assembly (which is like the state's law-making group) made it a town. The community was named after Millard Surrency. He was an important person who lived there a long time ago.
Geography of Surrency
Surrency is located at coordinates 31.724156 degrees north and 82.198686 degrees west. This means it's in the northern and western parts of the world. The town covers a total area of about 0.8 square miles (2.0 square kilometers). All of this area is land, with no large bodies of water inside the town limits.
Climate in Surrency
Surrency has a climate typical of Georgia. This means it has warm summers and mild winters. The weather can change quite a bit throughout the year. The table below shows more details about the temperatures and rainfall.
| Climate data for Surrency, Georgia, 1991–2020 normals, extremes 1956–2003 | |||||||||||||
|---|---|---|---|---|---|---|---|---|---|---|---|---|---|
| Month | Jan | Feb | Mar | Apr | May | Jun | Jul | Aug | Sep | Oct | Nov | Dec | Year |
| Record high °F (°C) | 83 (28) |
88 (31) |
90 (32) |
96 (36) |
98 (37) |
106 (41) |
105 (41) |
105 (41) |
100 (38) |
94 (34) |
88 (31) |
83 (28) |
106 (41) |
| Mean daily maximum °F (°C) | 63.0 (17.2) |
66.8 (19.3) |
73.2 (22.9) |
80.3 (26.8) |
86.3 (30.2) |
91.2 (32.9) |
92.0 (33.3) |
90.4 (32.4) |
87.8 (31.0) |
80.6 (27.0) |
71.4 (21.9) |
65.5 (18.6) |
79.0 (26.1) |
| Daily mean °F (°C) | 51.0 (10.6) |
53.5 (11.9) |
59.5 (15.3) |
66.1 (18.9) |
72.6 (22.6) |
79.4 (26.3) |
81.0 (27.2) |
79.7 (26.5) |
76.6 (24.8) |
67.8 (19.9) |
58.2 (14.6) |
52.8 (11.6) |
66.5 (19.2) |
| Mean daily minimum °F (°C) | 39.0 (3.9) |
40.3 (4.6) |
45.8 (7.7) |
51.9 (11.1) |
58.8 (14.9) |
67.6 (19.8) |
70.0 (21.1) |
68.9 (20.5) |
65.4 (18.6) |
55.0 (12.8) |
45.0 (7.2) |
40.2 (4.6) |
54.0 (12.2) |
| Record low °F (°C) | 1 (−17) |
12 (−11) |
16 (−9) |
29 (−2) |
39 (4) |
48 (9) |
55 (13) |
56 (13) |
38 (3) |
24 (−4) |
19 (−7) |
3 (−16) |
1 (−17) |
| Average precipitation inches (mm) | 3.57 (91) |
3.44 (87) |
3.88 (99) |
2.63 (67) |
3.23 (82) |
5.29 (134) |
4.98 (126) |
5.62 (143) |
4.25 (108) |
2.70 (69) |
2.25 (57) |
3.82 (97) |
45.66 (1,160) |
| Average precipitation days (≥ 0.01 in) | 9.8 | 7.3 | 8.8 | 6.2 | 6.7 | 11.8 | 11.4 | 10.9 | 8.8 | 5.9 | 5.9 | 7.8 | 101.3 |
| Source 1: NOAA | |||||||||||||
| Source 2: XMACIS2 | |||||||||||||
Population of Surrency
The population of Surrency has changed over the years. Here's a look at how many people have lived in the town during different census counts:
| Historical population | |||
|---|---|---|---|
| Census | Pop. | %± | |
| 1910 | 259 | — | |
| 1920 | 433 | 67.2% | |
| 1930 | 445 | 2.8% | |
| 1940 | 431 | −3.1% | |
| 1950 | 295 | −31.6% | |
| 1960 | 312 | 5.8% | |
| 1970 | 352 | 12.8% | |
| 1980 | 368 | 4.5% | |
| 1990 | 253 | −31.2% | |
| 2000 | 237 | −6.3% | |
| 2010 | 201 | −15.2% | |
| 2020 | 194 | −3.5% | |
| U.S. Decennial Census | |||
In the year 2000, the census showed that 237 people lived in Surrency. There were 98 households and 69 families. By 2020, the number of people living in the town went down to 194.
See also
 In Spanish: Surrency para niños
 | Victor J. Glover |
 | Yvonne Cagle |
 | Jeanette Epps |
 | Bernard A. Harris Jr. |

