Toconao facts for kids
Quick facts for kids
Toconao
|
|
|---|---|
|
Village
|
|

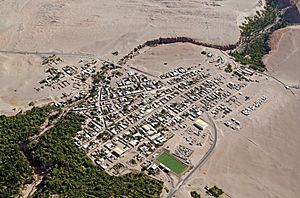
Toconao seen from above
|
|
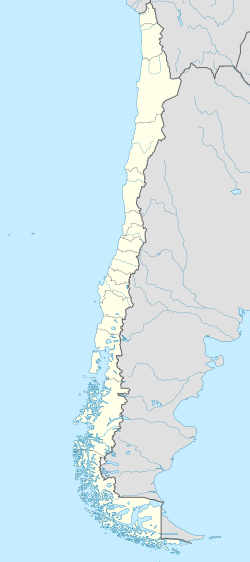
| Country | |
| Region | Antofagasta Region |
| Province | El Loa Province |
| Elevation | 2,485 m (8,153 ft) |
Toconao is a small village located in the northern part of Chile. It is about 38 kilometers (24 miles) south of the town of San Pedro de Atacama. This village sits high up, at an elevation of 2,485 meters (8,153 feet) above sea level. Toconao is also very close to the edge of a huge salt flat known as the Salar de Atacama.
The most famous building in Toconao is its beautiful church. What makes it special is that its bell tower is not attached to the main church building. This separate bell tower was built a long time ago, in 1750.
Climate in Toconao
Toconao has a very dry climate, which means it does not get much rain. The weather is usually warm during the day and cooler at night.
Temperatures Throughout the Year
The warmest months in Toconao are December and January, when the average high temperature is around 27.5 degrees Celsius (81.5 degrees Fahrenheit). The coolest months are June and July, with average high temperatures around 19 degrees Celsius (66.2 degrees Fahrenheit).
Nighttime temperatures are much cooler. In July, the average low can drop to about 3.3 degrees Celsius (37.9 degrees Fahrenheit). Even in the warmest months like January and December, the lows are around 11 degrees Celsius (51.8 degrees Fahrenheit).
Rainfall and Humidity
Toconao is very dry, receiving only about 31 millimeters (1.2 inches) of rain in an entire year. Most of this small amount of rain falls in January, February, and March. Some months, like April, July, August, October, and November, usually get no rain at all.
The air in Toconao is also very dry. The humidity is quite low throughout the year, often around 20-30 percent. This means the air feels very crisp and dry, especially compared to places with more moisture.
| Climate data for Toconao | |||||||||||||
|---|---|---|---|---|---|---|---|---|---|---|---|---|---|
| Month | Jan | Feb | Mar | Apr | May | Jun | Jul | Aug | Sep | Oct | Nov | Dec | Year |
| Mean daily maximum °C (°F) | 27.5 (81.5) |
27.3 (81.1) |
26.4 (79.5) |
24.8 (76.6) |
21.7 (71.1) |
19.0 (66.2) |
18.7 (65.7) |
21.0 (69.8) |
22.6 (72.7) |
24.9 (76.8) |
26.1 (79.0) |
27.6 (81.7) |
24.0 (75.2) |
| Mean daily minimum °C (°F) | 11.0 (51.8) |
11.2 (52.2) |
10.2 (50.4) |
8.6 (47.5) |
6.1 (43.0) |
3.8 (38.8) |
3.3 (37.9) |
5.3 (41.5) |
6.5 (43.7) |
8.3 (46.9) |
9.0 (48.2) |
11.2 (52.2) |
7.9 (46.2) |
| Average precipitation mm (inches) | 7 (0.3) |
11 (0.4) |
8 (0.3) |
0 (0) |
1 (0.0) |
2 (0.1) |
0 (0) |
0 (0) |
1 (0.0) |
0 (0) |
0 (0) |
1 (0.0) |
31 (1.2) |
| Average relative humidity (%) | 31 | 38 | 33 | 26 | 23 | 24 | 23 | 20 | 16 | 16 | 19 | 24 | 24 |
| Source: Atlas Agroclimatico de Chile (temperatures 1988–2007, precipitation 1975–2009, humidity 1988–2015) | |||||||||||||
See also
 In Spanish: Toconao para niños
 | Kyle Baker |
 | Joseph Yoakum |
 | Laura Wheeler Waring |
 | Henry Ossawa Tanner |


