Waterville, Wisconsin facts for kids
Quick facts for kids
Waterville, Wisconsin
|
|
|---|---|

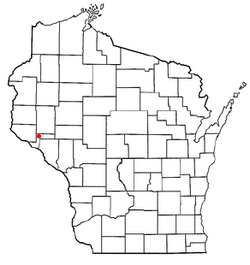
Location of Waterville, Wisconsin
|
|
| Country | |
| State | |
| County | Pepin |
| Area | |
| • Total | 36.2 sq mi (93.7 km2) |
| • Land | 35.7 sq mi (92.5 km2) |
| • Water | 0.5 sq mi (1.2 km2) |
| Elevation | 817 ft (249 m) |
| Population
(2020)
|
|
| • Total | 829 |
| • Density | 24.0/sq mi (9.3/km2) |
| Time zone | UTC-6 (Central (CST)) |
| • Summer (DST) | UTC-5 (CDT) |
| Area code(s) | 715 & 534 |
| FIPS code | 55-84025 |
| GNIS feature ID | 1584367 |
Waterville is a small town in Pepin County, Wisconsin, United States. In 2020, about 829 people lived there. A smaller area called Arkansaw is also part of the eastern side of Waterville.
Contents
About Waterville's Land
Waterville covers a total area of about 36.2 square miles (93.7 square kilometers). Most of this area, about 35.7 square miles (92.5 square kilometers), is land. The rest, about 0.5 square miles (1.2 square kilometers), is water.
Who Lives in Waterville?
In 2000, there were 859 people living in Waterville. These people lived in 331 households, and 229 of those were families. The town had about 24 people per square mile.
Most people in Waterville were White (98.95%). A small number were Asian (0.12%) or from other backgrounds. About 1.05% of the population identified as Hispanic or Latino.
Waterville was special in 2000 because it had the highest percentage of people who said they had Austrian ancestors in the entire United States, with 12.1% of its population.
Households and Families
Out of the 331 households in 2000:
- 31.4% had children under 18 living with them.
- 58.9% were married couples living together.
- 6.0% were led by a woman without a husband present.
- 30.8% were not families (meaning people living alone or with roommates).
- About 25.7% of all households were just one person.
- 12.7% had someone living alone who was 65 years old or older.
On average, there were 2.60 people in each household and 3.17 people in each family.
Age Groups
The people in Waterville were spread out across different age groups:
- 26.0% were under 18 years old.
- 7.6% were between 18 and 24 years old.
- 30.8% were between 25 and 44 years old.
- 20.3% were between 45 and 64 years old.
- 15.4% were 65 years old or older.
The average age in Waterville was 38 years. For every 100 females, there were about 118 males.
See also
 In Spanish: Waterville (Wisconsin) para niños
 | Laphonza Butler |
 | Daisy Bates |
 | Elizabeth Piper Ensley |

