Wilmot, Ohio facts for kids
Quick facts for kids
Wilmot, Ohio
|
|
|---|---|
|
Village
|
|

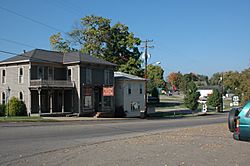
Streetside in Wilmot
|
|

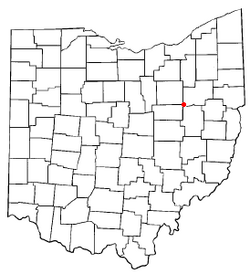
Location in the state of Ohio
|
|

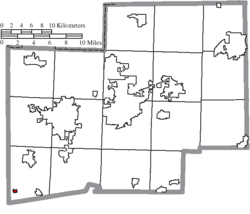
Location of Wilmot in Stark County
|
|
| Country | United States |
| State | Ohio |
| County | Stark |
| Township | Sugar Creek |
| Area | |
| • Total | 0.16 sq mi (0.42 km2) |
| • Land | 0.16 sq mi (0.42 km2) |
| • Water | 0.00 sq mi (0.00 km2) |
| Elevation | 1,034 ft (315 m) |
| Population
(2020)
|
|
| • Total | 282 |
| • Density | 1,719.51/sq mi (664.69/km2) |
| Time zone | UTC-5 (Eastern (EST)) |
| • Summer (DST) | UTC-4 (EDT) |
| FIPS code | 39-85806 |
| GNIS feature ID | 2399706 |
Wilmot is a small village located in southwestern Stark County, Ohio, United States. In 2020, the census counted 282 people living there. Wilmot is part of the larger Canton–Massillon metropolitan area.
Contents
History of Wilmot Village
Wilmot was first established in 1836. It was originally known by a different name, Milton. A post office opened in the village in 1866. At that time, its name officially changed to Wilmot.
Geography and Location
Wilmot is a very small village. According to the United States Census Bureau, its total area is about 0.14 square miles (0.36 square kilometers). All of this area is land, with no water.
Population and People
| Historical population | |||
|---|---|---|---|
| Census | Pop. | %± | |
| 1880 | 412 | — | |
| 1900 | 354 | — | |
| 1910 | 258 | −27.1% | |
| 1920 | 227 | −12.0% | |
| 1930 | 271 | 19.4% | |
| 1940 | 287 | 5.9% | |
| 1950 | 354 | 23.3% | |
| 1960 | 402 | 13.6% | |
| 1970 | 378 | −6.0% | |
| 1980 | 329 | −13.0% | |
| 1990 | 261 | −20.7% | |
| 2000 | 335 | 28.4% | |
| 2010 | 304 | −9.3% | |
| 2020 | 282 | −7.2% | |
| U.S. Decennial Census | |||
Wilmot Population in 2010
The census in 2010 showed that 304 people lived in Wilmot. There were 118 households, which means 118 different homes or groups of people living together. About 84 of these households were families.
The population density was about 2,171 people per square mile. This tells us how many people live in a certain amount of space. There were also 136 housing units, which are places where people can live.
Most of the people in Wilmot were White, making up 98.0% of the population. A small number were African American (0.3%) or Asian (0.3%). About 1.3% of the population identified with two or more races. A very small number, 0.3%, were Hispanic or Latino.
Households and Age in Wilmot
In 2010, 37.3% of the households in Wilmot had children under 18 years old. More than half, 52.5%, were married couples living together. Some households had a female head without a husband (11.0%), or a male head without a wife (7.6%). About 28.8% were non-family households.
The average number of people in a household was 2.58. For families, the average was 3.00 people.
The median age in the village was 31.7 years. This means half the people were younger than 31.7 and half were older. About 27.3% of residents were under 18. About 9.2% were 65 years old or older. The population was almost evenly split between males (52.6%) and females (47.4%).
See also
 In Spanish: Wilmot (Ohio) para niños

