Wilson, Ohio facts for kids
Quick facts for kids
Wilson, Ohio
|
|
|---|---|
|
Village
|
|

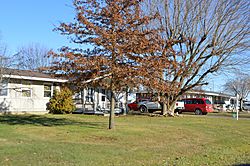
Houses on East Drive
|
|

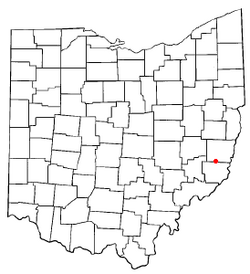
Location of Wilson, Ohio
|
|

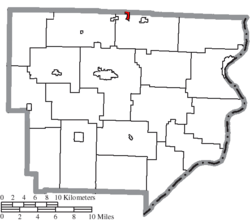
Location of Wilson in Monroe County
|
|
| Country | United States |
| State | Ohio |
| Counties | Monroe, Belmont |
| Area | |
| • Total | 0.47 sq mi (1.21 km2) |
| • Land | 0.41 sq mi (1.06 km2) |
| • Water | 0.06 sq mi (0.15 km2) |
| Elevation | 1,253 ft (382 m) |
| Population
(2020)
|
|
| • Total | 129 |
| • Density | 316.18/sq mi (122.10/km2) |
| Time zone | UTC-5 (Eastern (EST)) |
| • Summer (DST) | UTC-4 (EDT) |
| FIPS code | 39-85834 |
| GNIS feature ID | 2399707 |
Wilson is a small village located in the state of Ohio, USA. It is special because it sits across two different counties: Belmont County and Monroe County.
In 2020, about 129 people lived in Wilson. This village is also considered part of the larger Wheeling metropolitan area, which means it's connected to a bigger group of towns and cities.
Contents
About Wilson's Location
Wilson is located in the eastern part of Ohio. It covers a total area of about 0.47 square miles (1.21 square kilometers). Most of this area is land, about 0.41 square miles (1.06 square kilometers). A small part, about 0.06 square miles (0.15 square kilometers), is water.
How Many People Live in Wilson?
| Historical population | |||
|---|---|---|---|
| Census | Pop. | %± | |
| 1960 | 90 | — | |
| 1970 | 133 | 47.8% | |
| 1980 | 136 | 2.3% | |
| 1990 | 136 | 0.0% | |
| 2000 | 118 | −13.2% | |
| 2010 | 125 | 5.9% | |
| 2020 | 129 | 3.2% | |
| U.S. Decennial Census | |||
Wilson's Population in 2010
Let's look at what the 2010 census told us about Wilson. At that time, 125 people lived in the village. These people made up 56 households, and 37 of those were families.
The village had about 305 people per square mile. There were 68 housing units, which are places where people can live.
Most people in Wilson were White, making up 96% of the population. About 4% of the people were from two or more different racial backgrounds. A small group, 2.4%, were Hispanic or Latino.
Households and Families
In 2010, about 21.4% of the households in Wilson had children under 18 living there. More than half, 57.1%, were married couples living together. A small number of households were led by a single parent.
About 32.1% of households had only one person living in them. Of these, almost 20% were people aged 65 or older living alone. On average, each household had about 2.23 people, and each family had about 2.84 people.
Age and Gender in Wilson
The average age of people in Wilson in 2010 was 49.8 years old.
- 20% of residents were under 18 years old.
- 7.2% were between 18 and 24 years old.
- 15.2% were between 25 and 44 years old.
- 32% were between 45 and 64 years old.
- 25.6% were 65 years old or older.
When it came to gender, 52.8% of the people in Wilson were male, and 47.2% were female.
See also
 In Spanish: Wilson (Ohio) para niños

