Woodcock, Pennsylvania facts for kids
Quick facts for kids
Woodcock, Pennsylvania
|
|
|---|---|
|
Borough
|
|

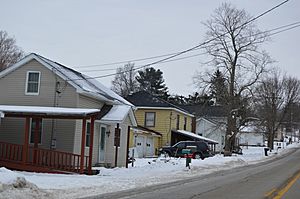
Houses on South Main Street (PA 86)
|
|

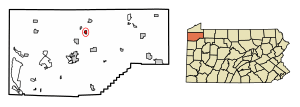
Location of Woodcock in Crawford County, Pennsylvania.
|
|
| Country | United States |
| State | Pennsylvania |
| County | Crawford |
| Founded | 1844 |
| Area | |
| • Total | 0.67 sq mi (1.73 km2) |
| • Land | 0.67 sq mi (1.73 km2) |
| • Water | 0.00 sq mi (0.00 km2) |
| Elevation
(middle of borough)
|
1,205 ft (367 m) |
| Highest elevation
(northeast corner of borough)
|
1,442 ft (440 m) |
| Lowest elevation
(Gravel Run)
|
1,180 ft (360 m) |
| Population
(2020)
|
|
| • Total | 140 |
| • Estimate
(2022)
|
138 |
| • Density | 223.39/sq mi (86.26/km2) |
| Time zone | UTC-4 (EST) |
| • Summer (DST) | UTC-5 (EDT) |
| Area code(s) | 814 |
Woodcock is a small and friendly borough located in Crawford County, Pennsylvania, United States. A borough is a type of town with its own local government. In 2020, about 140 people lived here.
Contents
Exploring Woodcock's Location
Woodcock is found in the northern part of Crawford County. It sits in a valley, which is a low area of land between hills. A small stream called Gravel Run flows through the borough. This stream eventually joins French Creek, which then flows into the Allegheny River.
Nearby Towns and Roads
Woodcock is surrounded by Woodcock Township on its west, south, and east sides. To the north, you'll find Cambridge Township. A main road, Pennsylvania Route 86, goes right through Woodcock. This road can take you northeast about 4 miles (6.4 km) to Cambridge Springs. If you head southwest for about 9 miles (14.5 km), you'll reach Meadville, which is the main city of Crawford County.
Size of Woodcock
Woodcock is a small place. It covers a total area of about 0.67 square miles (1.72 square kilometers). All of this area is land, meaning there are no large lakes or rivers within the borough's official borders.
Who Lives in Woodcock?
The number of people living in Woodcock has changed over many years. In 2020, the population was 140. This was a little less than the 157 people who lived there in 2010.
Population Changes Over Time
Here's a look at how Woodcock's population has changed through the years:
| Historical population | |||
|---|---|---|---|
| Census | Pop. | %± | |
| 1850 | 215 | — | |
| 1860 | 228 | 6.0% | |
| 1870 | 220 | −3.5% | |
| 1880 | 184 | −16.4% | |
| 1890 | 140 | −23.9% | |
| 1900 | 109 | −22.1% | |
| 1910 | 130 | 19.3% | |
| 1920 | 81 | −37.7% | |
| 1930 | 104 | 28.4% | |
| 1940 | 119 | 14.4% | |
| 1950 | 130 | 9.2% | |
| 1960 | 123 | −5.4% | |
| 1970 | 108 | −12.2% | |
| 1980 | 126 | 16.7% | |
| 1990 | 148 | 17.5% | |
| 2000 | 146 | −1.4% | |
| 2010 | 157 | 7.5% | |
| 2020 | 140 | −10.8% | |
| 2022 (est.) | 138 | −12.1% | |
| Sources: | |||
A Snapshot of Woodcock in 2000
Back in 2000, there were 146 people living in Woodcock. Most of the people living there were White. There were 55 households, which means 55 different homes where people lived. Many of these were families.
- Families and Households: About 36% of households had children under 18. Most households (69%) were married couples.
- Age Groups: The population was spread out in terms of age. About 20% were under 18, and 36% were between 25 and 44 years old. The average age was 38 years old.
- Income: The average income for a household in Woodcock was $50,500 per year. For families, it was $56,250.
See also
 In Spanish: Woodcock para niños
 | Victor J. Glover |
 | Yvonne Cagle |
 | Jeanette Epps |
 | Bernard A. Harris Jr. |


