
1997 Canadian federal election facts for kids
|
|||||||||||||||||||||||||||||||||||||||||||||||||||||||||||||||||||||||||||||||||||||||||
|
|
|||||||||||||||||||||||||||||||||||||||||||||||||||||||||||||||||||||||||||||||||||||||||
|
301 seats in the House of Commons 151 seats needed for a majority |
|||||||||||||||||||||||||||||||||||||||||||||||||||||||||||||||||||||||||||||||||||||||||
|---|---|---|---|---|---|---|---|---|---|---|---|---|---|---|---|---|---|---|---|---|---|---|---|---|---|---|---|---|---|---|---|---|---|---|---|---|---|---|---|---|---|---|---|---|---|---|---|---|---|---|---|---|---|---|---|---|---|---|---|---|---|---|---|---|---|---|---|---|---|---|---|---|---|---|---|---|---|---|---|---|---|---|---|---|---|---|---|---|---|
| Turnout | 67.0% ( |
||||||||||||||||||||||||||||||||||||||||||||||||||||||||||||||||||||||||||||||||||||||||
|
|||||||||||||||||||||||||||||||||||||||||||||||||||||||||||||||||||||||||||||||||||||||||

Popular vote by province, with graphs indicating the number of seats won. As this is an FPTP election, seat totals are not determined by popular vote by province but instead via results by each riding.
|
|||||||||||||||||||||||||||||||||||||||||||||||||||||||||||||||||||||||||||||||||||||||||
|
|||||||||||||||||||||||||||||||||||||||||||||||||||||||||||||||||||||||||||||||||||||||||


.png)
The 1997 Canadian federal election was a big event in Canada. On June 2, 1997, Canadians voted to choose who would represent them in the House of Commons. This is where laws are made for the whole country. The election decided the members of the 36th Parliament of Canada.
Contents
Understanding the Election Results
An election is how people choose their leaders. In Canada, we vote for Members of Parliament (MPs). These MPs then go to the House of Commons. The party with the most MPs usually forms the government. They also choose the Prime Minister.
How Many Seats Did Each Party Win?
There were 301 seats in the House of Commons. To win a majority, a party needed at least 151 seats. This means they would have more than half of all the seats.
Here's how the main parties did:
| ↓ | |||||
| 155 | 60 | 44 | 21 | 20 | 1 |
| Liberal | Reform | BQ | NDP | PC | I |
| Party | Party Leader | Candidates | Seats | Popular vote | ||||||
|---|---|---|---|---|---|---|---|---|---|---|
| 1993 | Dissol. | Elected | % Change | # | % | Change | ||||
| Liberal | Jean Chrétien | 301 | 177 | 174 | 155 | -12.4% | 4,994,277 | 38.46% | -2.78pp | |
| Reform | Preston Manning | 227 | 52 | 50 | 60 | +15.4% | 2,513,080 | 19.35% | +0.66pp | |
| Bloc Québécois | Gilles Duceppe | 75 | 54 | 50 | 44 | -18.5% | 1,385,821 | 10.67% | -2.85pp | |
| New Democratic | Alexa McDonough | 301 | 9 | 9 | 21 | +133.3% | 1,434,509 | 11.05% | +4.17pp | |
| Progressive Conservative | Jean Charest | 301 | 2 | 2 | 20 | +900% | 2,446,705 | 18.84% | +2.80pp | |
| Independent | 71 | 1 | 6 | 1 | 34,507 | 0.46% | -0.10pp | |||
| Green | Joan Russow | 79 | - | - | - | - | 55,583 | 0.43% | +0.18pp | |
| Natural Law | Neil Paterson | 136 | - | - | - | - | 37,085 | 0.29% | +x | |
| Christian Heritage | Ron Gray | 53 | - | - | - | - | 29,085 | 0.22% | +x | |
| No affiliation | 5 | - | - | - | - | 26,252 | 0.01% | -0.08pp | ||
| Canadian Action | Paul T. Hellyer | 58 | * | - | - | * | 17,502 | 0.13% | * | |
| Marxist–Leninist | Hardial Bains | 65 | - | - | - | - | 11,468 | 0.09% | +0.05pp | |
| Vacant | 4 | |||||||||
| Total | 1,672 | 295 | 295 | 301 | +2.0% | 12,985,974 | 100% | |||
| Sources: http://www.elections.ca History of Federal Ridings since 1867 | ||||||||||
Notes:
*: Party did not nominate candidates in the previous election.
x: Less than 0.005% of the popular vote
The Liberal Party, led by Jean Chrétien, won the most seats. They got 155 seats. This was enough for them to form a majority government. This means they had more than half of the seats. Jean Chrétien remained the Prime Minister.
The Reform Party, led by Preston Manning, came in second. They won 60 seats. The Bloc Québécois, led by Gilles Duceppe, won 44 seats. The New Democrats, led by Alexa McDonough, won 21 seats. The Progressive Conservative Party, led by Jean Charest, won 20 seats. There was also 1 independent Member of Parliament.
What is the Popular Vote?
The "popular vote" is the total number of votes each party received from all Canadians. It shows how many people voted for each party across the country.
| Popular vote | ||||
|---|---|---|---|---|
| Liberal | 38.46% | |||
| Reform | 19.35% | |||
| PC | 18.84% | |||
| NDP | 11.05% | |||
| Bloc Québécois | 10.67% | |||
| Green | 0.43% | |||
| Others | 1.20% | |||
The Liberal Party received 38.46% of the popular vote. The Reform Party got 19.35%, and the Progressive Conservatives got 18.84%. Even though the Liberals didn't get more than half of all votes, they won a majority of seats. This is how the Canadian election system works.
How Many Seats Did Each Party Get?
This chart shows the percentage of seats each party won in the House of Commons.
| Seat totals | ||||
|---|---|---|---|---|
| Liberal | 51.50% | |||
| Reform | 19.93% | |||
| Bloc Québécois | 14.62% | |||
| NDP | 6.98% | |||
| PC | 6.64% | |||
| Independents | 0.33% | |||
The Liberals won 51.50% of the seats. This is more than half, so they formed the government. The Reform Party won almost 20% of the seats.
Key Facts About the Election
- There were 10 political parties that took part in this election.
- The Canadian Action Party was a new party that appeared for the first time.
- This was the last time the Reform Party of Canada took part in an election.
- The Christian Heritage Party of Canada also had its last election before taking a break. They returned in 2004.
- In 1997, the party that came in second place (the Reform Party) did not have the most seats among all the opposition parties combined. This has only happened three times in Canadian history (1993, 1997, and 2008).
Images for kids
-
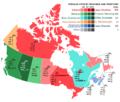
This map shows how people voted across Canada. The colours show which party was most popular in different areas.
See also
 In Spanish: Elecciones federales de Canadá de 1997 para niños
