
2016 United States presidential election in Florida facts for kids

The 2016 United States presidential election in Florida was a big event where people in Florida voted for who they wanted to be the next President of the United States. This election happened on November 8, 2016. It was part of the larger 2016 United States presidential election where all states and the District of Columbia also voted. Before the main election, on March 15, 2016, people in Florida also voted to choose which candidates would represent the main political parties. This process is called a primary election or caucus.
Contents
Presidential Election in Florida
What is Polling?
Before an election, groups often ask many people who they plan to vote for. This is called "polling." It helps guess who might win. The table below shows how people in Florida were planning to vote in the 2016 election. Florida is an important state because it often has very close election results. Before 2016, Florida had not voted for a Republican president since 2008.
| Poll source | Date administered | Democrat | % | Republican | % | Lead margin | Sample size | Margin of error |
|---|---|---|---|---|---|---|---|---|
| Quinnipiac University | November 3–6, 2016 | Hillary Clinton | 46% | Donald Trump | 46% | Tied | 884 | ± 3.3% |
| CNN/ORC | October 27 – November 1, 2016 | Hillary Clinton | 50% | Donald Trump | 49% | 1 | 773 | ± 3.5% |
| Quinnipiac University | October 27 – November 1, 2016 | Hillary Clinton | 47% | Donald Trump | 45% | 2 | 626 | ± 3.9% |
| Gravis Marketing/One America News Network | October 31, 2016 | Hillary Clinton | 51% | Donald Trump | 49% | 2 | 1,995 | ± 2.2% |
| New York Times Upshot/Siena College | October 25–27, 2016 | Hillary Clinton | 45% | Donald Trump | 48% | 3 | 814 | ± 3.4% |
| NBC News/Wall Street Journal/Marist | October 25–26, 2016 | Hillary Clinton | 46% | Donald Trump | 46% | Tied | 779 | ± 3.5% |
| University of North Florida | October 20–25, 2016 | Hillary Clinton | 46% | Donald Trump | 44% | 2 | 836 | ± 3.4% |
| Bloomberg/Selzer | October 21–24, 2016 | Hillary Clinton | 45% | Donald Trump | 46% | 1 | 953 | ± 3.2% |
| Quinnipiac University | October 10–16, 2016 | Hillary Clinton | 49% | Donald Trump | 45% | 4 | 660 | ± 3.8% |
| Public Policy Polling | October 12–13, 2016 | Hillary Clinton | 49% | Donald Trump | 44% | 5 | 985 | ± 3.1% |
| Ipsos/Reuters | October 5–12, 2016 | Hillary Clinton | 42% | Donald Trump | 40% | 2 | 1,532 | ± 2.9% |
| NBC News/Wall Street Journal/Marist | October 3–5, 2016 | Hillary Clinton | 46% | Donald Trump | 44% | 2 | 700 | ± 3.7% |
| University of North Florida | September 27 – October 4, 2016 | Hillary Clinton | 47% | Donald Trump | 40% | 7 | 696 | ± 3.8% |
| Quinnipiac University | September 27 – October 2, 2016 | Hillary Clinton | 49% | Donald Trump | 44% | 5 | 545 | ± 4.2% |
| Public Policy Polling | September 27–28, 2016 | Hillary Clinton | 48% | Donald Trump | 45% | 3 | 826 | ± 3.4% |
| Florida Chamber Political Institute | September 15–20, 2016 | Hillary Clinton | 45% | Donald Trump | 42% | 3 | 617 | ± 4.0% |
| New York Times Upshot/Siena College | September 10–14, 2016 | Hillary Clinton | 43% | Donald Trump | 43% | Tied | 867 | ± 3.3% |
| CNN/ORC | September 7–12, 2016 | Hillary Clinton | 46% | Donald Trump | 50% | 4 | 788 | ± 3.5% |
| Public Policy Polling | September 4–6, 2016 | Hillary Clinton | 47% | Donald Trump | 46% | 1 | 744 | ± 3.6% |
Final Results

On Election Day, November 8, 2016, millions of Floridians cast their votes. The table below shows the final results for the presidential candidates in Florida. The candidate with the most votes in the state wins all of Florida's electoral votes.
| Presidential election | ||
|---|---|---|
| Choice | Votes | % |
| Donald Trump (Republican) | 4,617,886 | 49.02% |
| Hillary Clinton (Democrat) | 4,504,975 | 47.82% |
| Gary Johnson | 207,043 | 2.20% |
| Jill Stein | 64,399 | 0.68% |
| Darrell Castle | 16,475 | 0.17% |
| Rocky De La Fuente | 9,108 | 0.10% |
| Total votes | 9,419,886 | 100% |
Primary Elections
Before the main presidential election, political parties hold primary elections or caucuses. This is how they choose which candidate will represent their party in the big election. In Florida, these votes happened in March 2016.
Democratic Primary
The Democratic Party held its primary election on March 15, 2016. Voters chose between candidates like Hillary Clinton and Bernie Sanders. The winner would then try to become the President for the Democratic Party.
| Democratic Primary Results | |||
|---|---|---|---|
| Choice | Votes | % | Delegates |
| Hillary Clinton | 1,101,414 | 64.44% | 165 |
| Bernie Sanders | 568,839 | 33.28% | 75 |
| Martin O'Malley | 38,930 | 2.28% | 0 |
| Uncommitted | 6 | ||
| Total votes | 100% | 246 | |
Republican Primary
The Republican Party held its primary election on March 1, 2016. Voters chose from several candidates, including Donald Trump and Marco Rubio. The person who won this primary would represent the Republican Party in the general election.
| Republican Primary Results | |||
|---|---|---|---|
| Choice | Votes | % | Delegates |
| Donald Trump | 1,079,870 | 45.72% | 99 |
| Marco Rubio | 638,661 | 27.04% | 0 |
| Ted Cruz | 404,891 | 17.14% | 0 |
| John Kasich | 159,976 | 6.77% | 0 |
| withdrawn candidates | 78,407 | 3.32% | 0 |
| Total votes | 2,361,805 | 100% | 99 |
Related pages
Images for kids
-
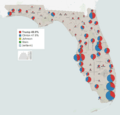
Results by county showing number of votes by size and candidates by color

