Aquilla, Ohio facts for kids
Quick facts for kids
Aquilla, Ohio
|
|
|---|---|

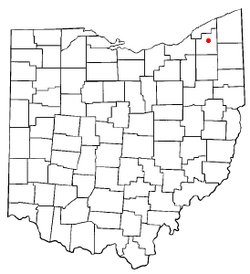
Location of Aquilla, Ohio
|
|

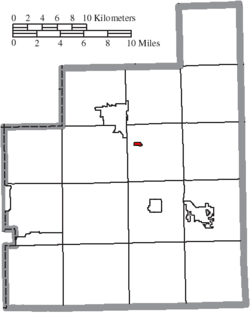
Location of Aquilla in Geauga County
|
|
| Country | United States |
| State | Ohio |
| County | Geauga |
| Area | |
| • Total | 0.15 sq mi (0.38 km2) |
| • Land | 0.15 sq mi (0.38 km2) |
| • Water | 0.00 sq mi (0.00 km2) |
| Elevation | 1,145 ft (349 m) |
| Population
(2020)
|
|
| • Total | 305 |
| • Estimate
(2023)
|
306 |
| • Density | 2,074.83/sq mi (798.54/km2) |
| Time zone | UTC-5 (Eastern (EST)) |
| • Summer (DST) | UTC-4 (EDT) |
| FIPS code | 39-02274 |
| GNIS feature ID | 2397975 |
Aquilla is a small place in Ohio, United States. It used to be a village, but now it's an unincorporated community. This means it doesn't have its own local government. Aquilla is located in Geauga County.
In 2020, about 305 people lived there. It is part of the larger Cleveland metropolitan area. In 2024, the people living in Aquilla voted to end its status as a village.
Contents
Geography
Aquilla is a very small area. According to official measurements, it covers about 0.15 square miles (0.38 square kilometers). All of this area is land, with no water.
Population Information
| Historical population | |||
|---|---|---|---|
| Census | Pop. | %± | |
| 1950 | 386 | — | |
| 1960 | 459 | 18.9% | |
| 1970 | 389 | −15.3% | |
| 1980 | 355 | −8.7% | |
| 1990 | 360 | 1.4% | |
| 2000 | 372 | 3.3% | |
| 2010 | 340 | −8.6% | |
| 2020 | 305 | −10.3% | |
| 2023 (est.) | 306 | −10.0% | |
| U.S. Decennial Census | |||
People in 2010
In 2010, there were 340 people living in Aquilla. These people lived in 128 different homes. Most of them, 97, were part of families.
The area had about 2,267 people per square mile. There were 150 housing units in total.
Most of the people living in Aquilla were White (97.9%). A small number were Asian (0.3%), and 1.8% were from two or more racial backgrounds.
Households and Families
Out of the 128 homes:
- 37.5% had children under 18 living there.
- 48.4% were married couples living together.
- 17.2% had a female head of the house with no husband.
- 10.2% had a male head of the house with no wife.
- 24.2% were not families.
About 19.5% of all homes had only one person living in them. And 4.7% of homes had someone living alone who was 65 years old or older. On average, about 2.66 people lived in each home, and 2.98 people lived in each family.
Age Groups
The average age of people in Aquilla was 39.3 years old.
- 28.5% of residents were under 18 years old.
- 6.2% were between 18 and 24 years old.
- 24.9% were between 25 and 44 years old.
- 30.6% were between 45 and 64 years old.
- 9.7% were 65 years old or older.
The population was almost evenly split between genders. About 49.4% were male, and 50.6% were female.
See also
 In Spanish: Aquilla (Ohio) para niños
 | Precious Adams |
 | Lauren Anderson |
 | Janet Collins |

