Baldwin, Illinois facts for kids
Quick facts for kids
Baldwin
|
|
|---|---|
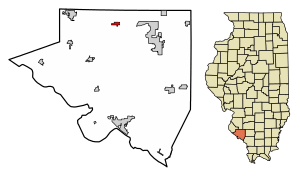
Location of Baldwin in Randolph County, Illinois.
|
|
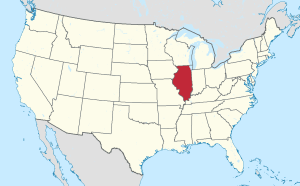
Location of Illinois in the United States
|
|
| Country | United States |
| State | Illinois |
| County | Randolph |
| Area | |
| • Total | 0.67 sq mi (1.72 km2) |
| • Land | 0.67 sq mi (1.72 km2) |
| • Water | 0.00 sq mi (0.00 km2) |
| Population
(2020)
|
|
| • Total | 314 |
| • Density | 471.47/sq mi (182.10/km2) |
| Time zone | UTC-6 (CST) |
| • Summer (DST) | UTC-5 (CDT) |
| ZIP Code(s) |
62217
|
| Area code(s) | 618 |
| FIPS code | 17-03454 |
| Wikimedia Commons | Baldwin, Illinois |
Baldwin is a small village located in Randolph County, Illinois, United States. It's a quiet place where people live and work.
As of the 2020 census, about 314 people lived in Baldwin. A special area called the Baldwin Lake State Fish and Wildlife Area is also nearby.
Contents
Where is Baldwin Located?
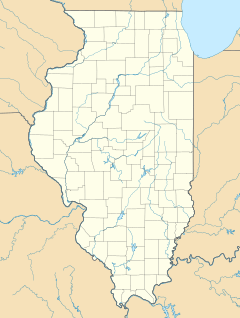
Baldwin is found in the state of Illinois. Its exact location is 38°11′02″N 89°50′41″W / 38.183767°N 89.844658°W.
The village covers a total area of about 0.67 square miles (1.72 square kilometers). All of this area is land, with no large bodies of water inside the village limits.
How Many People Live in Baldwin?
The number of people living in Baldwin has changed over the years. Here's a look at the population counts from different U.S. censuses:
| Historical population | |||
|---|---|---|---|
| Census | Pop. | %± | |
| 1880 | 271 | — | |
| 1890 | 298 | 10.0% | |
| 1900 | 381 | 27.9% | |
| 1910 | 358 | −6.0% | |
| 1920 | 353 | −1.4% | |
| 1930 | 332 | −5.9% | |
| 1940 | 341 | 2.7% | |
| 1950 | 354 | 3.8% | |
| 1960 | 336 | −5.1% | |
| 1970 | 467 | 39.0% | |
| 1980 | 474 | 1.5% | |
| 1990 | 426 | −10.1% | |
| 2000 | 3,627 | 751.4% | |
| 2010 | 373 | −89.7% | |
| 2020 | 314 | −15.8% | |
| U.S. Decennial Census | |||
Baldwin's Population in 2020
In the 2020 census, 314 people lived in Baldwin. Most residents identified as White. A small number of people identified as being of mixed race or Hispanic/Latino.
| Race / Ethnicity (NH = Non-Hispanic) | Pop 2000 | Pop 2010 | Pop 2020 | % 2000 | % 2010 | % 2020 |
|---|---|---|---|---|---|---|
| White alone (NH) | 1,200 | 360 | 294 | 33.09% | 96.51% | 93.63% |
| Black or African American alone (NH) | 2,131 | 0 | 0 | 58.75% | 0.00% | 0.00% |
| Native American or Alaska Native alone (NH) | 1 | 0 | 0 | 0.03% | 0.00% | 0.00% |
| Asian alone (NH) | 6 | 1 | 0 | 0.17% | 0.27% | 0.00% |
| Pacific Islander alone (NH) | 1 | 0 | 0 | 0.03% | 0.00% | 0.00% |
| Other race alone (NH) | 0 | 0 | 0 | 0.00% | 0.00% | 0.00% |
| Mixed race or Multiracial (NH) | 6 | 7 | 16 | 0.17% | 1.88% | 5.10% |
| Hispanic or Latino (any race) | 282 | 5 | 4 | 7.78% | 1.34% | 1.27% |
| Total | 3,627 | 373 | 314 | 100.00% | 100.00% | 100.00% |
Baldwin's Population in 2010
In 2010, Baldwin had 373 residents living in 146 households. About 101 of these households were families. The village had about 533 people per square mile.
- Most people (97.9%) were White.
- About 1.9% of the population identified as being of two or more races.
- About 1.3% of the population was Hispanic or Latino.
Many households (28.1%) had children under 18 living with them. About 47.9% of households were married couples. The average household had 2.55 people.
The population was spread out by age. About 24.7% were under 18 years old. About 11.0% were 65 years or older. The average age in the village was 36.5 years.
See also
 In Spanish: Baldwin (Illinois) para niños
 | James Van Der Zee |
 | Alma Thomas |
 | Ellis Wilson |
 | Margaret Taylor-Burroughs |


