
Borsbeek facts for kids
Quick facts for kids
Borsbeek
|
|||
|---|---|---|---|
|
District of Antwerp
|
|||
| District Borsbeek | |||
 |
|||
|
|||

Borsbeek
Location in Belgium

Borsbeek
Location in Antwerp Province
|
|||
| Country | |||
| Community | |||
| Region | |||
| Province | |||
| Arrondissement | Antwerp | ||
| Municipality | Antwerp | ||
| Area | |||
| • Total | 3.9 km2 (1.5 sq mi) | ||
| Population
(2021-01-01)
|
|||
| • Total | 10,949 | ||
| • Density | 2,810/km2 (7,270/sq mi) | ||
| Postal codes |
2150
|
||
| Area codes | 03 | ||
| Website | http://www.borsbeek.be | ||


Borsbeek is a district located in Antwerp, Belgium. It was once a separate town but is now part of the larger city of Antwerp. Borsbeek is found in the Flemish Region of Belgium.
Contents
A Look at Borsbeek's Past
Borsbeek has a long and interesting history. The first time it was mentioned in official records was in the year 1232. A few years later, in 1264, it became its own independent parish, which is like a local church area.
Early History and Challenges
For many years, until the 1500s, Borsbeek was part of an area called the County of Cantecroy. During the late 16th century, a big conflict known as the Dutch Revolt caused a lot of trouble. Borsbeek was attacked and damaged many times during this period. Later, in 1746, the village faced another difficult time during the War of the Austrian Succession, where it was almost completely destroyed.
From Farms to Homes
For a long time, Borsbeek was mainly a farming community. People grew crops and raised animals. However, in the middle of the 20th century, things started to change. Borsbeek became known for growing plants and flowers, a practice called horticulture. It also grew into a popular place for people to live, becoming a residential town.
Becoming Part of Antwerp
On January 28, 2022, the leaders of Borsbeek and Antwerp announced a big decision. They planned for Borsbeek to join the city of Antwerp. Both local governments agreed to this plan. As of January 1, 2025, Borsbeek officially became the 10th district of the city of Antwerp. This means it is now a part of the larger city.
Climate in Borsbeek
| Climate data for Borsbeek (1991−2020 normals) | |||||||||||||
|---|---|---|---|---|---|---|---|---|---|---|---|---|---|
| Month | Jan | Feb | Mar | Apr | May | Jun | Jul | Aug | Sep | Oct | Nov | Dec | Year |
| Mean daily maximum °C (°F) | 6.6 (43.9) |
7.6 (45.7) |
11.1 (52.0) |
15.3 (59.5) |
18.9 (66.0) |
21.6 (70.9) |
23.7 (74.7) |
23.5 (74.3) |
20.0 (68.0) |
15.3 (59.5) |
10.3 (50.5) |
7.0 (44.6) |
15.1 (59.2) |
| Daily mean °C (°F) | 3.9 (39.0) |
4.3 (39.7) |
6.9 (44.4) |
10.2 (50.4) |
14.0 (57.2) |
16.9 (62.4) |
19.0 (66.2) |
18.6 (65.5) |
15.3 (59.5) |
11.3 (52.3) |
7.2 (45.0) |
4.4 (39.9) |
11.0 (51.8) |
| Mean daily minimum °C (°F) | 1.1 (34.0) |
1.0 (33.8) |
2.7 (36.9) |
5.0 (41.0) |
9.1 (48.4) |
12.2 (54.0) |
14.2 (57.6) |
13.7 (56.7) |
10.7 (51.3) |
7.3 (45.1) |
4.1 (39.4) |
1.8 (35.2) |
6.9 (44.4) |
| Average precipitation mm (inches) | 69.9 (2.75) |
61.5 (2.42) |
55.3 (2.18) |
42.3 (1.67) |
59.5 (2.34) |
73.9 (2.91) |
79.3 (3.12) |
85.1 (3.35) |
72.3 (2.85) |
66.8 (2.63) |
77.3 (3.04) |
91.4 (3.60) |
834.6 (32.86) |
| Average precipitation days (≥ 1.0 mm) | 12.4 | 11.1 | 10.4 | 8.6 | 9.7 | 10.0 | 10.3 | 10.5 | 9.7 | 10.8 | 12.5 | 13.9 | 129.9 |
| Mean monthly sunshine hours | 59 | 77 | 134 | 190 | 219 | 219 | 225 | 211 | 164 | 116 | 65 | 50 | 1,729 |
| Source: Royal Meteorological Institute | |||||||||||||
People from Borsbeek
You can find more information about people who come from Borsbeek by looking at the Category:People from Borsbeek.
Images for kids
-
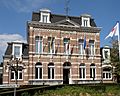
The Town Hall of Borsbeek
-
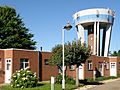
The Water Tower of Borsbeek
-
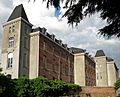
The St Josef Institute building
-
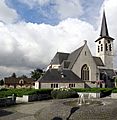
The St Jacobs Church


More Information
- Official website: http://www.borsbeek.be
See also
 In Spanish: Borsbeek para niños
