Byron, Oklahoma facts for kids
Quick facts for kids
Byron, Oklahoma
|
|
|---|---|

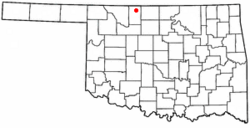
Location of Byron, Oklahoma
|
|
| Country | United States |
| State | Oklahoma |
| County | Alfalfa |
| Area | |
| • Total | 0.25 sq mi (0.65 km2) |
| • Land | 0.25 sq mi (0.65 km2) |
| • Water | 0.00 sq mi (0.00 km2) |
| Elevation | 1,194 ft (364 m) |
| Population
(2020)
|
|
| • Total | 37 |
| • Density | 146.83/sq mi (56.69/km2) |
| Time zone | UTC-6 (Central (CST)) |
| • Summer (DST) | UTC-5 (CDT) |
| ZIP code |
73722
|
| Area code(s) | 580 |
| FIPS code | 40-10650 |
| GNIS feature ID | 2413145 |
Byron is a small town in Alfalfa County, Oklahoma, United States. In 2020, about 37 people lived there. It is a quiet place with an interesting history.
Contents
History of Byron
Byron got its name from Postmaster V. C. Spurrier. He officially named the town on April 27, 1898. The town was named after his relative, Byron Spurrier, who owned a store there.
At first, Byron was part of Woods County. But in 1907, when Oklahoma became a state, Byron became part of the new Alfalfa County.
Early Days and Moving the Town
When Byron was first listed in a state guide in 1898, it grew slowly. This was because it did not have a railroad nearby. But things changed in April 1901. A man named W. C. Edwards bought land for a new town site. This new spot was about a mile south and half a mile east of the original settlement.
Within a month, all the existing businesses moved to the new location. A new bank, a meat market, and a lumberyard quickly opened. In April 1902, the county government officially made Byron an incorporated town. This meant it could govern itself.
People expected the Kansas City, Mexico and Orient Railway to build a line through the county. So, a large building for storing grain was built in October. When the train line finally reached Byron on October 21, the town celebrated! They had a huge bonfire. The railroad workers even got lemonade, cigars, and local apples.
Growth with the Railroad
After the railroad arrived, Byron's economy grew a lot. The town's population reached its highest point of 286 people by 1909.
Many businesses opened in Byron. These included the Byron State Bank and two newspapers. The newspapers were called the Byron Republican and the Byron Promoter. The town also had both a Christian church and a Methodist church. There were two hardware stores, three general stores, a blacksmith, and a flour mill.
Farmers in the area grew wheat and alfalfa. Byron became an important place to buy and sell grain and farm animals. In 1929, one of Oklahoma's four warm-water fish hatcheries was built here. A fish hatchery is a place where fish are raised. This hatchery still produces fish for state lakes and farm ponds today.
Challenges and Changes
However, Byron began to face tough times. Farm prices dropped, and the Great Depression hit the country. By 1930, the town's population had fallen to 197 residents.
An interesting event happened in 1935. Five women were elected to the town board. They replaced five men who were already serving. These women worked hard to pay off the town's debt. They also started making money for the town by selling electricity to its residents.
Despite these efforts, the railroad stopped using its line through Byron in 1942. Through the 1940s and 1950s, only a few businesses were still open. As fewer people lived in the countryside, Byron's school joined with schools from nearby Driftwood. Later, in the 1960s, schools from Burlington, Amorita, Byron, and Driftwood all combined. They formed one school located in Burlington.
Byron's population continued to drop. It was 131 in 1950, 72 in 1970, and only 57 in 1990. By the year 2000, 45 people lived there. In 2010, the U.S. Census counted just 35 residents.
Geography
Byron is located along State Highway 58. The town covers a total area of about 0.24 square miles (0.65 square kilometers). All of this area is land.
Demographics
| Historical population | |||
|---|---|---|---|
| Census | Pop. | %± | |
| 1910 | 286 | — | |
| 1920 | 249 | −12.9% | |
| 1930 | 197 | −20.9% | |
| 1940 | 177 | −10.2% | |
| 1950 | 131 | −26.0% | |
| 1960 | 82 | −37.4% | |
| 1970 | 72 | −12.2% | |
| 1980 | 67 | −6.9% | |
| 1990 | 57 | −14.9% | |
| 2000 | 45 | −21.1% | |
| 2010 | 35 | −22.2% | |
| 2020 | 37 | 5.7% | |
| U.S. Decennial Census | |||
The table above shows how Byron's population has changed over the years. Demographics is the study of populations, including how many people live in a place and how that number changes over time.
See also
 In Spanish: Byron (Oklahoma) para niños
 | Emma Amos |
 | Edward Mitchell Bannister |
 | Larry D. Alexander |
 | Ernie Barnes |

