
Cartesian coordinate system facts for kids

The Cartesian coordinate system is a special way to find the exact spot of a point on a flat surface, like a map. In math, we call this surface a plane. To do this, we use two numbers. These numbers are usually called the x-coordinate and the y-coordinate.
Imagine two straight lines that cross each other at a perfect right angle (like the corner of a square). These lines are called axes. The horizontal line is the x-axis, and the vertical line is the y-axis. Where they cross is called the origin, which is the point (0,0).
You can also use the Cartesian system in 3D space. This is done by adding a third number, the z-coordinate. Each extra coordinate helps us describe a new direction or dimension.
Contents
What are Cartesian Coordinates Used For?

This system is super helpful for drawing shapes using math equations. You can take an algebra equation, like x² + y² = 4, and use it to plot many points on the Cartesian grid. When you connect all these points, a shape appears! For example, the equation x² + y² = 4 creates a perfect circle.
It helps us see how math equations look as pictures. This is a big part of a math area called analytic geometry.
Who Invented the Cartesian System?
The name Cartesian comes from a famous French mathematician and philosopher named René Descartes. His Latin name was Cartesius. Descartes had a brilliant idea: he wanted to combine algebra (working with numbers and equations) with Euclidean geometry (working with shapes and spaces).
His work was very important. It helped create new areas of math like calculus. It also helped with cartography, which is the art of making maps.
Descartes first shared his ideas about this system in 1637. He wrote about it in two of his books. In Discourse on Method, he explained how to plot the position of a point using two perpendicular lines as guides. He explored these ideas even more in his book La Géométrie.
Related pages
Images for kids
-
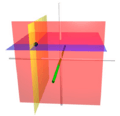
The coordinate surfaces of the Cartesian coordinates (x, y, z). The z-axis is vertical and the x-axis is highlighted in green. Thus, the red hyperplane shows the points with x = 1, the blue hyperplane shows the points with z = 1, and the yellow hyperplane shows the points with y = −1. The three surfaces intersect at the point P (shown as a black sphere) with the Cartesian coordinates (1, −1, 1).
-
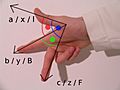
The right-hand rule
-
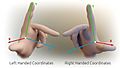
3D Cartesian coordinate handedness


See also
 In Spanish: Coordenadas cartesianas para niños
