Catawba, Ohio facts for kids
Quick facts for kids
Catawba, Ohio
|
|
|---|---|
|
Village
|
|

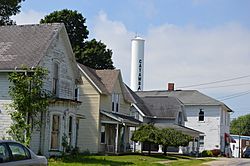
Houses on Pleasant Street
|
|

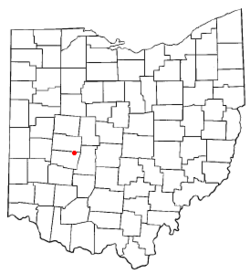
Location of Catawba, Ohio
|
|

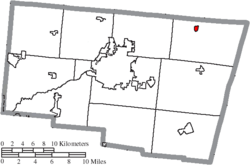
Location of Catawba in Clark County
|
|
| Country | United States |
| State | Ohio |
| County | Clark |
| Township | Pleasant |
| Area | |
| • Total | 0.23 sq mi (0.60 km2) |
| • Land | 0.23 sq mi (0.60 km2) |
| • Water | 0.00 sq mi (0.00 km2) |
| Elevation | 1,234 ft (376 m) |
| Population
(2020)
|
|
| • Total | 245 |
| • Estimate
(2023)
|
241 |
| • Density | 1,060.61/sq mi (409.94/km2) |
| Time zone | UTC-5 (Eastern (EST)) |
| • Summer (DST) | UTC-4 (EDT) |
| ZIP code |
43010
|
| Area code(s) | 937, 326 |
| FIPS code | 39-12560 |
| GNIS feature ID | 2397575 |
Catawba is a small village in Clark County, Ohio, United States. It is a part of the larger Springfield, Ohio area. In 2020, about 245 people lived there.
Contents
History of Catawba
Catawba was first planned and settled in 1838. The village was named after the Catawba people, a Native American tribe. A post office, where people could send and receive mail, opened in Catawba in 1839.
Geography of Catawba
Catawba is a very small village. It covers an area of about 0.23 square miles (0.60 square kilometers). All of this area is land, meaning there are no large lakes or rivers within the village limits.
People of Catawba
| Historical population | |||
|---|---|---|---|
| Census | Pop. | %± | |
| 1870 | 318 | — | |
| 1880 | 250 | −21.4% | |
| 1890 | 272 | 8.8% | |
| 1900 | 231 | −15.1% | |
| 1910 | 234 | 1.3% | |
| 1920 | 258 | 10.3% | |
| 1930 | 244 | −5.4% | |
| 1940 | 279 | 14.3% | |
| 1950 | 313 | 12.2% | |
| 1960 | 355 | 13.4% | |
| 1970 | 323 | −9.0% | |
| 1980 | 317 | −1.9% | |
| 1990 | 268 | −15.5% | |
| 2000 | 312 | 16.4% | |
| 2010 | 272 | −12.8% | |
| 2020 | 245 | −9.9% | |
| 2023 (est.) | 241 | −11.4% | |
| U.S. Decennial Census | |||
Catawba's Population in 2020
In 2020, there were 245 people living in Catawba. There were 123 households, which are groups of people living together in one home. About 81 of these households were families.
Most people in Catawba were White (91.9%). A small number of people were African American (0.4%), Asian (0.4%), or from two or more races (6.9%). No one identified as Hispanic or Latino in the 2020 census.
The average age of people in Catawba was 48.4 years old.
- About 16.6% of residents were under 18 years old.
- About 12.4% were between 18 and 24 years old.
- About 16.2% were between 25 and 44 years old.
- About 24.2% were between 45 and 64 years old.
- About 30.7% were 65 years old or older.
More males lived in the village (54.4%) than females (45.5%).
Catawba's Population in 2010
In 2010, Catawba had 272 people. There were 95 households, and 72 of these were families.
Most people in Catawba were White (98.9%). A small number were African American (0.7%) or Asian (0.4%). About 0.4% of the population was Hispanic or Latino.
The average age in 2010 was 36.5 years.
- About 30.5% of residents were under 18 years old.
- About 5.6% were between 18 and 24 years old.
- About 28.3% were between 25 and 44 years old.
- About 24.3% were between 45 and 64 years old.
- About 11.4% were 65 years old or older.
There were slightly more males (51.8%) than females (48.2%) in 2010.
See also
 In Spanish: Catawba (Ohio) para niños
 | Janet Taylor Pickett |
 | Synthia Saint James |
 | Howardena Pindell |
 | Faith Ringgold |

