Cheviot, Ohio facts for kids
Quick facts for kids
Cheviot, Ohio
|
|||
|---|---|---|---|
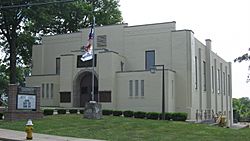
Cheviot's 1930s fieldhouse and community center
|
|||
|
|||
| Motto(s):
"Big City Spirit - Small Town Charm"
|
|||
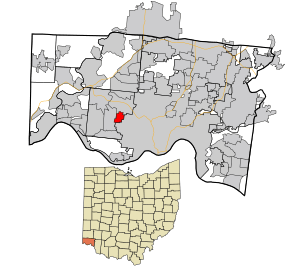
Location in Hamilton County and the state of Ohio
|
|||
| Country | United States | ||
| State | Ohio | ||
| County | Hamilton | ||
| Area | |||
| • Total | 1.17 sq mi (3.02 km2) | ||
| • Land | 1.17 sq mi (3.02 km2) | ||
| • Water | 0.00 sq mi (0.00 km2) | ||
| Elevation | 919 ft (280 m) | ||
| Population
(2020)
|
|||
| • Total | 8,658 | ||
| • Estimate
(2023)
|
8,565 | ||
| • Density | 7,425.39/sq mi (2,865.99/km2) | ||
| Time zone | UTC-5 (Eastern (EST)) | ||
| • Summer (DST) | UTC-4 (EDT) | ||
| ZIP code |
45211
|
||
| Area code(s) | 513 | ||
| FIPS code | 39-14128 | ||
| GNIS feature ID | 1086200 | ||
Cheviot is a city in Hamilton County, Ohio, United States. It's like a smaller town right next to the bigger city of Cincinnati. In 2020, about 8,658 people lived there. Cheviot is known for its motto: "Big City Spirit - Small Town Charm."
Contents
History of Cheviot
Cheviot was started in 1818 by a Scottish immigrant named John Craig. He bought a large piece of land, about 320 acres, in Green Township. On this land, he built an inn and a tavern.
On March 21, 1818, John Craig planned out a new town. He named it Cheviot after the Cheviot Hills in southern Scotland, where he came from. People started buying land here, and the town began to grow.
Cheviot officially became a village in 1901. Later, in 1931, it grew even more and became a city. At first, Cheviot was mostly a farming area. Today, it is a place where many people live, close to Cincinnati.
Geography and Climate
Cheviot is located about 7 miles northwest of downtown Cincinnati. The city covers a total area of about 1.17 square miles, and all of it is land.
Cheviot's Weather Patterns
Cheviot experiences a variety of weather throughout the year. Summers are generally warm, and winters can be cold with some snow. The city gets a good amount of rain spread across the seasons.
| Climate data for Cheviot, Ohio, 1991–2020 normals, extremes 1970–present | |||||||||||||
|---|---|---|---|---|---|---|---|---|---|---|---|---|---|
| Month | Jan | Feb | Mar | Apr | May | Jun | Jul | Aug | Sep | Oct | Nov | Dec | Year |
| Record high °F (°C) | 68 (20) |
76 (24) |
85 (29) |
88 (31) |
93 (34) |
101 (38) |
103 (39) |
102 (39) |
100 (38) |
97 (36) |
81 (27) |
74 (23) |
103 (39) |
| Mean maximum °F (°C) | 61.2 (16.2) |
65.3 (18.5) |
75.1 (23.9) |
82.2 (27.9) |
88.1 (31.2) |
92.3 (33.5) |
94.3 (34.6) |
93.8 (34.3) |
90.8 (32.7) |
83.2 (28.4) |
72.0 (22.2) |
63.7 (17.6) |
95.5 (35.3) |
| Mean daily maximum °F (°C) | 37.4 (3.0) |
42.0 (5.6) |
51.9 (11.1) |
64.8 (18.2) |
74.0 (23.3) |
81.8 (27.7) |
85.4 (29.7) |
84.6 (29.2) |
78.2 (25.7) |
66.0 (18.9) |
52.5 (11.4) |
41.6 (5.3) |
63.4 (17.4) |
| Daily mean °F (°C) | 29.8 (−1.2) |
33.3 (0.7) |
42.2 (5.7) |
53.9 (12.2) |
63.6 (17.6) |
72.0 (22.2) |
75.4 (24.1) |
74.3 (23.5) |
67.5 (19.7) |
55.7 (13.2) |
43.7 (6.5) |
34.3 (1.3) |
53.8 (12.1) |
| Mean daily minimum °F (°C) | 22.2 (−5.4) |
24.7 (−4.1) |
32.6 (0.3) |
43.0 (6.1) |
53.3 (11.8) |
62.1 (16.7) |
65.4 (18.6) |
64.0 (17.8) |
56.8 (13.8) |
45.3 (7.4) |
34.9 (1.6) |
27.0 (−2.8) |
44.3 (6.8) |
| Mean minimum °F (°C) | 1.3 (−17.1) |
5.7 (−14.6) |
14.8 (−9.6) |
27.3 (−2.6) |
37.4 (3.0) |
49.7 (9.8) |
55.5 (13.1) |
53.9 (12.2) |
43.0 (6.1) |
31.0 (−0.6) |
20.0 (−6.7) |
10.1 (−12.2) |
−1.1 (−18.4) |
| Record low °F (°C) | −23 (−31) |
−9 (−23) |
−4 (−20) |
17 (−8) |
28 (−2) |
38 (3) |
47 (8) |
45 (7) |
30 (−1) |
22 (−6) |
11 (−12) |
−24 (−31) |
−24 (−31) |
| Average precipitation inches (mm) | 3.59 (91) |
3.19 (81) |
4.47 (114) |
4.91 (125) |
5.21 (132) |
4.85 (123) |
4.32 (110) |
3.47 (88) |
3.32 (84) |
3.47 (88) |
3.42 (87) |
3.96 (101) |
48.18 (1,224) |
| Average snowfall inches (cm) | 6.0 (15) |
4.3 (11) |
2.4 (6.1) |
0.2 (0.51) |
0.0 (0.0) |
0.0 (0.0) |
0.0 (0.0) |
0.0 (0.0) |
0.0 (0.0) |
0.3 (0.76) |
0.2 (0.51) |
2.6 (6.6) |
16.0 (41) |
| Average extreme snow depth inches (cm) | 4.1 (10) |
3.8 (9.7) |
2.2 (5.6) |
0.1 (0.25) |
0.0 (0.0) |
0.0 (0.0) |
0.0 (0.0) |
0.0 (0.0) |
0.0 (0.0) |
0.2 (0.51) |
0.4 (1.0) |
2.2 (5.6) |
6.4 (16) |
| Average precipitation days (≥ 0.01 in) | 11.8 | 9.8 | 11.9 | 11.7 | 12.4 | 11.2 | 10.2 | 7.6 | 7.8 | 8.3 | 9.3 | 11.5 | 123.5 |
| Average snowy days (≥ 0.1 in) | 4.4 | 4.1 | 1.8 | 0.3 | 0.0 | 0.0 | 0.0 | 0.0 | 0.0 | 0.1 | 0.3 | 3.0 | 14.0 |
| Source 1: NOAA | |||||||||||||
| Source 2: National Weather Service | |||||||||||||
People of Cheviot
Cheviot has seen its population change over the years. It grew a lot in the early 1900s. The city's population reached its highest point in the 1970s.
| Historical population | |||
|---|---|---|---|
| Census | Pop. | %± | |
| 1880 | 325 | — | |
| 1910 | 1,930 | — | |
| 1920 | 4,108 | 112.8% | |
| 1930 | 8,046 | 95.9% | |
| 1940 | 9,043 | 12.4% | |
| 1950 | 9,944 | 10.0% | |
| 1960 | 10,701 | 7.6% | |
| 1970 | 11,135 | 4.1% | |
| 1980 | 9,888 | −11.2% | |
| 1990 | 9,616 | −2.8% | |
| 2000 | 9,015 | −6.2% | |
| 2010 | 8,375 | −7.1% | |
| 2020 | 8,658 | 3.4% | |
| 2023 (est.) | 8,565 | 2.3% | |
| Sources: | |||
Cheviot's Population in 2020
In 2020, there were 8,658 people living in Cheviot. This means there were about 7,425 people per square mile. Most residents were White (71.1%), and a good number were African American (20.8%). People from other backgrounds also live in Cheviot.
There were 3,174 households in the city. About 34.8% of these households had children under 18. The average household had about 2.27 people. The median age in Cheviot was 32.8 years old. This means half the people were younger than 32.8, and half were older.
Cheviot's Population in 2010
Back in 2010, Cheviot had 8,375 people. The population density was about 7,158 people per square mile. Most people were White (89.0%), and 7.3% were African American.
There were 3,779 households. About 27.0% of these had children under 18. The average household size was 2.18 people. The median age was 34.6 years.
Culture and Community Events
Cheviot shares many cultural traditions with the wider Cincinnati area, especially those from German-American heritage. The city is famous for its yearly Harvest Home Fair. This fair has been held every year since 1855. It takes place on the weekend after Labor Day.
In 2002, Cheviot started another popular event called the West Fest Street Festival. This festival has grown a lot. It features local food, fun activities, rides for kids, and live music. Cheviot is also part of the Cincinnati Public School district.
Famous People from Cheviot
Cheviot has been home to several notable people:
- Dorothy Mueller – A professional baseball player.
- Glenn Ryle – A well-known TV personality from WKRC-TV. He hosted "Skipper Ryle" and "Bowling For Dollars."
- Al Schottelkotte – A famous TV news anchor for WCPO from 1959 to 1994.
- Steve Tensi – A former professional football quarterback.
- Andy Williams – A very popular singer and television personality.
See also
 In Spanish: Cheviot (Ohio) para niños
 | Ernest Everett Just |
 | Mary Jackson |
 | Emmett Chappelle |
 | Marie Maynard Daly |


