Climate of London facts for kids
| Weather chart for London, United Kingdom | |||||||||||||||||||||||||||||||||||||||||||||||
|---|---|---|---|---|---|---|---|---|---|---|---|---|---|---|---|---|---|---|---|---|---|---|---|---|---|---|---|---|---|---|---|---|---|---|---|---|---|---|---|---|---|---|---|---|---|---|---|
| J | F | M | A | M | J | J | A | S | O | N | D | ||||||||||||||||||||||||||||||||||||
|
59
8
3
|
45
9
3
|
39
12
4
|
42
15
6
|
46
18
9
|
47
22
12
|
46
24
14
|
53
23
14
|
50
20
12
|
65
16
9
|
67
11
5
|
57
9
3
|
||||||||||||||||||||||||||||||||||||
| temperatures in °C precipitation totals in mm |
|||||||||||||||||||||||||||||||||||||||||||||||
|
Imperial conversion
|
|||||||||||||||||||||||||||||||||||||||||||||||
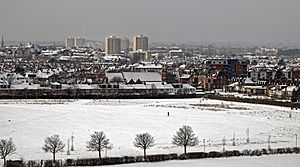
London has a type of weather called a temperate oceanic climate. This means it has cool winters and mild summers. You can expect cloudy skies and rain showers often, and sometimes even snow in winter. Rain falls pretty evenly throughout the whole year.
People have been watching London's weather for a very long time. Records of rainfall started way back in January 1697 at Kew Gardens. A weather station at Greenwich has been recording temperatures since 1841. This gives us London's longest continuous temperature history. Other important weather stations are at Heathrow, Hampstead, Northolt, and St James's Park.
Contents
London's Weather Extremes
London can sometimes have very hot or very cold days. The hottest temperature ever recorded was 40.2 °C (104.4 °F) (about 104.4°F). This happened on July 19, 2022, at both Heathrow Airport and St James's Park. The coldest temperature ever was −16.1 °C (3.0 °F) (about 3°F) on January 1, 1962.
The coldest high temperature for a day was −8.3 °C (17.1 °F) (about 17.1°F). This happened three times: in 1841, 1867, and 1987. The warmest low temperature recorded overnight was 25.8 °C (78.4 °F) (about 78.4°F) in Kenley on July 19, 2022. London also holds national records for the highest temperatures in February, April, May, and June.
Snow, Thunderstorms, and Tornadoes
Snow doesn't fall very often in London, only about 16 days a year on average. When it does snow, it's usually not very heavy. Thunderstorms are also not very common, happening about 16 days a year.
It's very rare for London to have tornadoes. However, a strong tornado did hit Kensal Green on December 7, 2006. Generally, very severe weather and extreme temperatures are unusual in London.
Climate Change Concerns
London is facing challenges because of climate change in the United Kingdom. Experts who study water are worried that homes in London might not have enough water before the year 2050. This is a serious concern for the city's future.
Climate Data for London
Here are some average temperatures for London, based on records from the London Weather Centre.
London Weather Centre Averages
| Climate data for London Weather Centre, 2001-2009 seminormals | |||||||||||||
|---|---|---|---|---|---|---|---|---|---|---|---|---|---|
| Month | Jan | Feb | Mar | Apr | May | Jun | Jul | Aug | Sep | Oct | Nov | Dec | Year |
| Mean daily maximum °C (°F) | 8.5 (47.3) |
8.9 (48.0) |
11.7 (53.1) |
15.7 (60.3) |
18.5 (65.3) |
22.4 (72.3) |
23.6 (74.5) |
23.2 (73.8) |
20.8 (69.4) |
16.1 (61.0) |
11.9 (53.4) |
8.6 (47.5) |
15.8 (60.5) |
| Mean daily minimum °C (°F) | 5.0 (41.0) |
4.7 (40.5) |
5.8 (42.4) |
8.2 (46.8) |
10.9 (51.6) |
14.1 (57.4) |
15.5 (59.9) |
15.5 (59.9) |
13.7 (56.7) |
10.9 (51.6) |
8.0 (46.4) |
5.4 (41.7) |
9.8 (49.7) |
| Source 1: Weather Online | |||||||||||||
| Source 2: Tutiempo | |||||||||||||
UV Index in London
The Ultraviolet index tells you how strong the sun's UV rays are. This helps you know when to protect your skin.
| Jan | Feb | Mar | Apr | May | Jun | Jul | Aug | Sep | Oct | Nov | Dec | Year |
|---|---|---|---|---|---|---|---|---|---|---|---|---|
| 1 | 1 | 2 | 4 | 5 | 6 | 6 | 5 | 4 | 2 | 1 | 0 | 3.4 |


