Clipper Mills, California facts for kids
Quick facts for kids
Clipper Mills
|
|
|---|---|

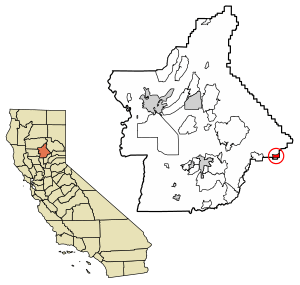
Location of Clipper Mills in Butte County, California.
|
|
| Country | |
| State | |
| County | Butte County |
| Area | |
| • Total | 1.74 sq mi (4.50 km2) |
| • Land | 1.74 sq mi (4.50 km2) |
| • Water | 0.00 sq mi (0.00 km2) 0% |
| Elevation | 3,550 ft (1,082 m) |
| Population
(2020)
|
|
| • Total | 160 |
| • Density | 92.01/sq mi (35.53/km2) |
| Time zone | UTC-8 (Pacific (PST)) |
| • Summer (DST) | UTC-7 (PDT) |
| ZIP Code |
95930
|
| Area code(s) | 530 |
| GNIS feature IDs | 1655908; 2612476 |
Clipper Mills (sometimes called Clipper Mill) is a small community in Butte County, California. It's a special type of place called a census-designated place, which means it's a community that is counted for the census but isn't officially a city or town. Clipper Mills is located high up, about 3,550 feet (1,082 meters) above sea level. It has its own post office, which first opened in 1861. The area's zip code is 95930. In 2010, 142 people lived in Clipper Mills, and by 2020, the population grew to 160.
The history and economy of Clipper Mills are mostly about the lumber industry. This means cutting down trees and processing wood. A sawmill, which is a factory for cutting timber, started working nearby in 1852. By 1855, Clipper Mills had its own sawmills, showing how important wood production was to the community.
Who Lives in Clipper Mills?
| Historical population | |||
|---|---|---|---|
| Census | Pop. | %± | |
| 2020 | 160 | — | |
| U.S. Decennial Census | |||
In 2010, there were 142 people living in Clipper Mills. Most of the people were White (92.3%). A small number were Native American (2.1%), and some people were from two or more races (4.2%). About 3.5% of the population was Hispanic or Latino.
There were 77 homes in Clipper Mills. Many homes (42.9%) had just one person living in them. About 23.4% of homes had someone living alone who was 65 or older. The average number of people in each home was 1.84. There were 36 families, with an average of 2.39 people per family.
The ages of the people living in Clipper Mills varied. About 9.2% were under 18 years old. Many people were older, with 40.1% aged 45 to 64, and 31.7% aged 65 or older. The average age was 55.4 years.
Most people (84.5%) owned their homes, while 15.5% rented.
What is the Climate Like?
Clipper Mills has a type of weather called a warm-summer Mediterranean climate. This means it has warm, dry summers, but they are not usually extremely hot. The average monthly temperatures don't go above 71.6°F (22°C). Winters are generally mild and wet.
| Climate data for Clipper Mills, California | |||||||||||||
|---|---|---|---|---|---|---|---|---|---|---|---|---|---|
| Month | Jan | Feb | Mar | Apr | May | Jun | Jul | Aug | Sep | Oct | Nov | Dec | Year |
| Record high °F (°C) | 79 (26) |
77 (25) |
80 (27) |
86 (30) |
94 (34) |
101 (38) |
101 (38) |
102 (39) |
105 (41) |
95 (35) |
86 (30) |
76 (24) |
105 (41) |
| Mean maximum °F (°C) | 65 (18) |
66 (19) |
70 (21) |
76 (24) |
83 (28) |
90 (32) |
94 (34) |
94 (34) |
92 (33) |
85 (29) |
74 (23) |
65 (18) |
96 (36) |
| Mean daily maximum °F (°C) | 49.8 (9.9) |
50.9 (10.5) |
53.9 (12.2) |
59.1 (15.1) |
67.2 (19.6) |
76.7 (24.8) |
84.4 (29.1) |
84.4 (29.1) |
79.8 (26.6) |
69.7 (20.9) |
56.8 (13.8) |
49.3 (9.6) |
65.2 (18.4) |
| Daily mean °F (°C) | 39.9 (4.4) |
40.7 (4.8) |
43.1 (6.2) |
47.4 (8.6) |
54.6 (12.6) |
62.5 (16.9) |
68.8 (20.4) |
68.2 (20.1) |
64.2 (17.9) |
55.6 (13.1) |
45.6 (7.6) |
39.8 (4.3) |
52.5 (11.4) |
| Mean daily minimum °F (°C) | 29.8 (−1.2) |
30.5 (−0.8) |
32.4 (0.2) |
35.7 (2.1) |
42.1 (5.6) |
48.4 (9.1) |
53.1 (11.7) |
52.0 (11.1) |
48.5 (9.2) |
41.5 (5.3) |
34.4 (1.3) |
30.4 (−0.9) |
39.9 (4.4) |
| Mean minimum °F (°C) | 20 (−7) |
21 (−6) |
24 (−4) |
26 (−3) |
32 (0) |
38 (3) |
45 (7) |
44 (7) |
39 (4) |
31 (−1) |
25 (−4) |
19 (−7) |
15 (−9) |
| Record low °F (°C) | 7 (−14) |
5 (−15) |
12 (−11) |
16 (−9) |
20 (−7) |
25 (−4) |
33 (1) |
34 (1) |
29 (−2) |
19 (−7) |
11 (−12) |
3 (−16) |
3 (−16) |
| Average precipitation inches (mm) | 15.62 (397) |
13.34 (339) |
12.65 (321) |
6.01 (153) |
3.10 (79) |
0.96 (24) |
0.17 (4.3) |
0.29 (7.4) |
1.01 (26) |
4.50 (114) |
10.28 (261) |
14.31 (363) |
82.24 (2,088.7) |
| Average snowfall inches (cm) | 18.6 (47) |
20.1 (51) |
19.8 (50) |
8.0 (20) |
0.7 (1.8) |
0.0 (0.0) |
0.0 (0.0) |
0.0 (0.0) |
0.0 (0.0) |
0.6 (1.5) |
5.8 (15) |
17.3 (44) |
90.9 (230.3) |
| Source: NOAA | |||||||||||||
See also
 In Spanish: Clipper Mills para niños


