Conca de Dalt facts for kids
Quick facts for kids
Conca de Dalt
|
|
|---|---|
|
Municipality
|
|

Conca de dalt
|
|
| Country | |
| Community | |
| Province | Lleida |
| Comarca | Pallars Jussà |
| Area | |
| • Total | 166.5 km2 (64.3 sq mi) |
| Elevation | 507 m (1,663 ft) |
| Population
(2018)
|
|
| • Total | 428 |
| • Density | 2.571/km2 (6.658/sq mi) |
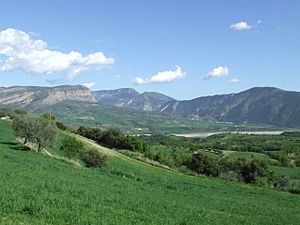
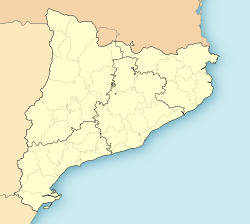
Conca de Dalt is a special type of town, called a municipality, located in Catalonia, Spain. It's part of a larger area known as the Pallars Jussà comarca. This municipality stretches across the beautiful valley of the Noguera Pallaresa river.
Conca de Dalt was formed in 1969 when twelve smaller towns joined together. For a while, it was called Pallars Jussà, but its name was changed in 1995 to Conca de Dalt. This was done to avoid confusion with the larger comarca (region) that has the same name.
Contents
What is Conca de Dalt?
Conca de Dalt is a municipality in the Lleida province of Catalonia, Spain. It's a place where several smaller villages and towns come together to form one larger administrative area. The area is known for its natural beauty, especially around the Noguera Pallaresa river.
Villages and Towns in Conca de Dalt
The municipality of Conca de Dalt is made up of twelve different villages and settlements. Each one has its own unique charm! Here are some of them, with their populations from 2005:
- Aramunt (103 people)
- Claverol (26 people)
- Erinyà (29 people) - This village is close to a cool gorge (a narrow valley) formed by the Flamicell river.
- Hortoneda (45 people)
- Pessonada (50 people)
- El Pont de Claverol (11 people) - This is where the ajuntament (town hall) is located, which is like the main office for the municipality.
- Rivert (37 people)
- Sant Martí de Canals (51 people)
- Serradell (16 people)
- Sossís (32 people) - This village has a coal mine and a hydroelectric power station, which uses water to make electricity!
- Toralla (23 people)
- Torallola (16 people)
Population Changes in Conca de Dalt
The number of people living in Conca de Dalt has changed over the years. This is called demography. Here's a look at how the population has grown or shrunk:
| 1900 | 1930 | 1950 | 1970 | 1986 | 2007 |
|---|---|---|---|---|---|
| 2014 | 1789 | 1289 | 665 | 481 | 434 |
As you can see, the population was much higher in the early 1900s and has become smaller over time.
See also
 In Spanish: Conca de Dalt para niños
 | Stephanie Wilson |
 | Charles Bolden |
 | Ronald McNair |
 | Frederick D. Gregory |


