Decaturville, Tennessee facts for kids
Quick facts for kids
Decaturville, Tennessee
|
|
|---|---|

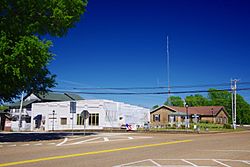
Main Street and Pleasant Street
|
|

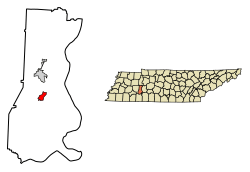
Location of Decaturville in Decatur County, Tennessee.
|
|
| Country | United States |
| State | Tennessee |
| County | Decatur |
| Area | |
| • Total | 1.65 sq mi (4.28 km2) |
| • Land | 1.65 sq mi (4.28 km2) |
| • Water | 0.00 sq mi (0.00 km2) |
| Elevation | 518 ft (158 m) |
| Population
(2020)
|
|
| • Total | 807 |
| • Density | 488.50/sq mi (188.59/km2) |
| Time zone | UTC-6 (Central (CST)) |
| • Summer (DST) | UTC-5 (CDT) |
| ZIP code |
38329
|
| Area code(s) | 731 |
| FIPS code | 47-19900 |
| GNIS feature ID | 1282275 |
Decaturville is a small town in Tennessee, United States. It is the main town, also known as the county seat, of Decatur County. In 2020, about 807 people lived there. The town was named after Stephen Decatur, Jr., a famous American naval officer from the American Revolutionary War.
Where is Decaturville?
Decaturville is located in western Tennessee. Its exact spot is 35°34′59″N 88°7′19″W / 35.58306°N 88.12194°W. The town covers a total area of about 1.7 square miles (4.28 square kilometers). All of this area is land, with no large bodies of water inside the town limits.
What is the weather like?
The weather in Decaturville changes throughout the year. Summers are usually warm, and winters are cool. This area gets a good amount of rain. You can see more details about the temperatures and rainfall in the chart below.
| Climate data for Decaturville, Tennessee, 1991–2020 normals, extremes 2010–present | |||||||||||||
|---|---|---|---|---|---|---|---|---|---|---|---|---|---|
| Month | Jan | Feb | Mar | Apr | May | Jun | Jul | Aug | Sep | Oct | Nov | Dec | Year |
| Record high °F (°C) | 74 (23) |
81 (27) |
87 (31) |
89 (32) |
92 (33) |
101 (38) |
101 (38) |
100 (38) |
98 (37) |
96 (36) |
88 (31) |
78 (26) |
101 (38) |
| Mean daily maximum °F (°C) | 47.9 (8.8) |
52.7 (11.5) |
61.8 (16.6) |
71.4 (21.9) |
77.9 (25.5) |
84.6 (29.2) |
88.0 (31.1) |
88.0 (31.1) |
83.4 (28.6) |
72.6 (22.6) |
61.0 (16.1) |
51.0 (10.6) |
70.0 (21.1) |
| Daily mean °F (°C) | 37.5 (3.1) |
41.6 (5.3) |
49.8 (9.9) |
59.4 (15.2) |
67.6 (19.8) |
74.9 (23.8) |
78.5 (25.8) |
77.6 (25.3) |
71.4 (21.9) |
59.7 (15.4) |
49.0 (9.4) |
40.6 (4.8) |
59.0 (15.0) |
| Mean daily minimum °F (°C) | 27.1 (−2.7) |
30.4 (−0.9) |
37.7 (3.2) |
47.4 (8.6) |
57.3 (14.1) |
65.2 (18.4) |
68.9 (20.5) |
67.2 (19.6) |
59.4 (15.2) |
46.7 (8.2) |
37.0 (2.8) |
30.1 (−1.1) |
47.9 (8.8) |
| Record low °F (°C) | −2 (−19) |
2 (−17) |
5 (−15) |
26 (−3) |
34 (1) |
48 (9) |
54 (12) |
53 (12) |
40 (4) |
26 (−3) |
— | −4 (−20) |
−4 (−20) |
| Average precipitation inches (mm) | 4.64 (118) |
4.59 (117) |
5.60 (142) |
5.85 (149) |
4.61 (117) |
5.53 (140) |
4.73 (120) |
3.28 (83) |
4.24 (108) |
3.66 (93) |
4.44 (113) |
5.73 (146) |
56.90 (1,445) |
| Average precipitation days (≥ 0.01 in) | 11.6 | 12.6 | 13.2 | 10.6 | 11.6 | 10.7 | 9.7 | 9.8 | 7.5 | 8.3 | 9.8 | 11.7 | 127.1 |
| Source 1: NOAA | |||||||||||||
| Source 2: National Weather Service | |||||||||||||
Who lives in Decaturville?
The number of people living in Decaturville has changed over many years. Here is a look at how the population has grown and shrunk since 1850.
| Historical population | |||
|---|---|---|---|
| Census | Pop. | %± | |
| 1850 | 168 | — | |
| 1870 | 188 | — | |
| 1880 | 252 | 34.0% | |
| 1920 | 315 | — | |
| 1930 | 419 | 33.0% | |
| 1940 | 433 | 3.3% | |
| 1950 | 514 | 18.7% | |
| 1960 | 571 | 11.1% | |
| 1970 | 958 | 67.8% | |
| 1980 | 1,004 | 4.8% | |
| 1990 | 879 | −12.5% | |
| 2000 | 859 | −2.3% | |
| 2010 | 867 | 0.9% | |
| 2020 | 807 | −6.9% | |
| Sources: | |||
In 2000, there were 859 people living in Decaturville. These people lived in 349 different homes. About 214 of these were families. Most of the people living in the town were White (about 85.91%), and about 11.87% were African American. A small number of people were from other backgrounds.
About 25.8% of the homes had children under 18 living there. Many homes (46.7%) were married couples living together. Some homes (11.7%) had a female head of the house without a husband. About 35.8% of all homes had only one person living in them. A good number of these single-person homes (17.5%) were people aged 65 or older.
The average age of people in Decaturville was 43 years old. About 20.4% of the population was under 18. About 22.7% were 65 years or older. The town had slightly more females than males.
The average income for a household in the town was about $23,056 per year. For families, the average income was higher, around $37,857 per year. About 22.4% of all people in Decaturville, and 17.9% of families, lived below the poverty line. This included about 29.0% of children under 18 and 23.7% of people aged 65 or older.
See also
In Spanish: Decaturville (Tennessee) para niños
 | Jackie Robinson |
 | Jack Johnson |
 | Althea Gibson |
 | Arthur Ashe |
 | Muhammad Ali |


