Deenwood, Georgia facts for kids
Quick facts for kids
Deenwood, Georgia
|
|
|---|---|

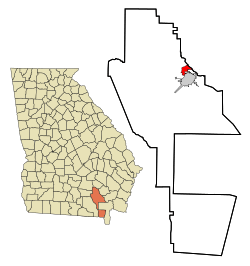
Location in Ware County and the state of Georgia
|
|
| Country | United States |
| State | Georgia |
| County | Ware |
| Area | |
| • Total | 3.39 sq mi (8.77 km2) |
| • Land | 3.35 sq mi (8.69 km2) |
| • Water | 0.03 sq mi (0.09 km2) |
| Elevation | 135 ft (41 m) |
| Population
(2020)
|
|
| • Total | 2,207 |
| • Density | 658.02/sq mi (254.09/km2) |
| Time zone | UTC-5 (Eastern (EST)) |
| • Summer (DST) | UTC-4 (EDT) |
| FIPS code | 13-22080 |
| GNIS feature ID | 0357663 |
Deenwood is a small community in Ware County, Georgia, United States. It's known as an unincorporated community, which means it doesn't have its own local government like a city or town. It's also a census-designated place (CDP), which is an area the government uses for counting people. In 2020, about 2,207 people lived there. Deenwood is part of the larger Waycross area. A local church, Deenwood Baptist Church, shares its name with the community.
Contents
Where is Deenwood Located?
Deenwood is found at specific coordinates: 31.238993 degrees North and -82.371540 degrees West. This location is in the state of Georgia.
The community covers a total area of about 3.4 square miles (8.77 square kilometers). Almost all of this area is land.
What is Deenwood's Climate Like?
Deenwood has a warm and humid climate. This means it gets relatively high temperatures and a good amount of rain throughout the year. It's known as a humid subtropical climate. On climate maps, this type of weather is often shown as "Cfa".
Here's a quick look at the average temperatures and rainfall:
| Climate data for Deenwood, Georgia | |||||||||||||
|---|---|---|---|---|---|---|---|---|---|---|---|---|---|
| Month | Jan | Feb | Mar | Apr | May | Jun | Jul | Aug | Sep | Oct | Nov | Dec | Year |
| Mean daily maximum °C (°F) | 16 (60) |
19 (66) |
22 (71) |
26 (78) |
29 (84) |
32 (89) |
33 (91) |
32 (89) |
30 (86) |
26 (78) |
22 (71) |
17 (62) |
25 (77) |
| Mean daily minimum °C (°F) | 4 (39) |
6 (42) |
9 (48) |
12 (53) |
16 (60) |
20 (68) |
21 (69) |
21 (69) |
19 (66) |
14 (57) |
9 (48) |
5 (41) |
13 (55) |
| Average precipitation mm (inches) | 130 (5.1) |
97 (3.8) |
110 (4.5) |
48 (1.9) |
56 (2.2) |
130 (5.2) |
140 (5.7) |
180 (7.1) |
110 (4.2) |
89 (3.5) |
76 (3) |
74 (2.9) |
1,250 (49.2) |
| Source: Weatherbase | |||||||||||||
How Many People Live in Deenwood?
The population of Deenwood has changed over the years. Here's how the number of people living there has grown and shrunk:
| Historical population | |||
|---|---|---|---|
| Census | Pop. | %± | |
| 1950 | 1,113 | — | |
| 1960 | 2,758 | 147.8% | |
| 1970 | 3,015 | 9.3% | |
| 1980 | 3,580 | 18.7% | |
| 1990 | 2,055 | −42.6% | |
| 2000 | 1,836 | −10.7% | |
| 2010 | 2,146 | 16.9% | |
| 2020 | 2,207 | 2.8% | |
| U.S. Decennial Census 1950 and 1960 as Hebardville |
|||
In the 1950s and 1960s, this area was known as Hebardville. Later, in 1970, it was officially renamed Deenwood. In 1980, it became a census-designated place (CDP).
Who Lives in Deenwood?
The community of Deenwood is home to people from different backgrounds. The U.S. Census keeps track of this information.
- In 2000, about 91% of the people were White.
- By 2020, this percentage changed to about 72.7%.
- The number of Black or African American residents grew from 7.3% in 2000 to 18.35% in 2020.
- Other groups, including Asian, Native American, and people of mixed races, also live in Deenwood.
- The number of people who identify as Hispanic or Latino has also increased over time.
In 2020, the total population of Deenwood was 2,207 people.
See also
 In Spanish: Deenwood para niños
 | Leon Lynch |
 | Milton P. Webster |
 | Ferdinand Smith |

