El Carmen de Bolívar facts for kids
Quick facts for kids
El Carmen de Bolívar
|
|||
|---|---|---|---|
|
Municipality and town
|
|||
 |
|||
|
|||

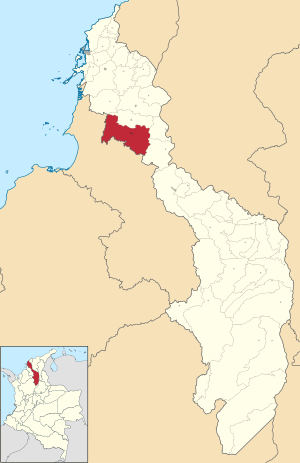
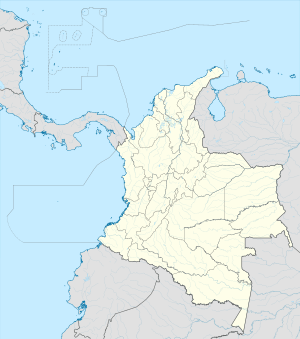
Location of the municipality and town of El Carmen de Bolívar in the Bolívar Department of Colombia
|
|||
| Country | |||
| Department | |||
| Founded | 1776 | ||
| Area | |||
| • Municipality and town | 946.3 km2 (365.4 sq mi) | ||
| • Urban | 5.36 km2 (2.07 sq mi) | ||
| Elevation | 197 m (646 ft) | ||
| Population
(2018 census)
|
|||
| • Municipality and town | 70,131 | ||
| • Density | 74.111/km2 (191.946/sq mi) | ||
| • Urban | 50,844 | ||
| • Urban density | 9,486/km2 (24,568/sq mi) | ||
| Demonym(s) | Carmero | ||
| Area code(s) | 605 | ||
| Website | Official website: http://www.elcarmen-bolivar.gov.co/ | ||
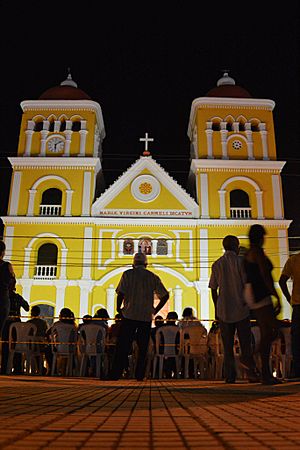
El Carmen de Bolívar is a town and municipality in the Bolívar Department of Colombia. It's about 114 kilometers (71 miles) southeast of Cartagena de Indias. This town is the biggest and most important place in the Montes de María region.
It's the third most populated municipality in its department. El Carmen de Bolívar is known as the "agricultural and food pantry" of Bolívar. This is because it supplies a lot of products like avocado, tobacco, cocoa, bananas, and yams. It's also called the "Sweet City of Colombia" because it makes many delicious sweets. These include Chepacorinas Cookies, Coco Casadilla, and Panochas.
The town has a great location for transport. It connects the Caribbean coast of Colombia with other parts of the country. It also links the western part of Colombia to big ports like Barranquilla and Cartagena.
During Colombia's fight for independence, the people of El Carmen de Bolívar strongly supported the cause. Because of their help, the town was officially recognized in 1812. Later, in the 1800s, it became very important for trade. Farmers sent products like tobacco and coffee from here to Barranquilla through the Magdalena River. This made it a major export center until the mid-1900s.
Contents
History of El Carmen de Bolívar
This area was first home to Native American tribes like the Malibúes, Farotos, and Piletas. Later, in 1776, a Spanish officer named Antonio de La Torre y Miranda founded the town. He named it sitio de Nuestra Señora del Carmen, which means "Our Lady of El Carmen site." This was done under the orders of Juan de Torrezal Díaz de Pimienta, who was the Governor of Cartagena of Indies.
Geography of El Carmen de Bolívar
The municipality of El Carmen de Bolívar is located in a key area. It is south of San Jacinto, Bolívar, and north of Ovejas, Sucre. To its west are Zambrano, Bolívar and Córdoba, Bolívar. To its east is San Onofre, Sucre. The total area of the municipality is about 954 square kilometers (368 square miles).
Climate Information
The climate in El Carmen de Bolívar is generally warm. The table below shows detailed weather information for the area. It includes average high and low temperatures, rainfall, and hours of sunshine throughout the year.
| Climate data for El Carmen de Bolívar (Carmen de Bolivar), elevation 152 m (499 ft), (1981–2010) | |||||||||||||
|---|---|---|---|---|---|---|---|---|---|---|---|---|---|
| Month | Jan | Feb | Mar | Apr | May | Jun | Jul | Aug | Sep | Oct | Nov | Dec | Year |
| Mean daily maximum °C (°F) | 34.2 (93.6) |
35.0 (95.0) |
35.0 (95.0) |
34.1 (93.4) |
32.8 (91.0) |
32.9 (91.2) |
33.7 (92.7) |
33.4 (92.1) |
32.3 (90.1) |
31.7 (89.1) |
32.0 (89.6) |
33.0 (91.4) |
33.4 (92.1) |
| Daily mean °C (°F) | 27.2 (81.0) |
27.8 (82.0) |
28.1 (82.6) |
28.0 (82.4) |
27.6 (81.7) |
27.7 (81.9) |
27.8 (82.0) |
27.5 (81.5) |
26.9 (80.4) |
26.5 (79.7) |
26.6 (79.9) |
26.9 (80.4) |
27.4 (81.3) |
| Mean daily minimum °C (°F) | 19.7 (67.5) |
20.2 (68.4) |
21.3 (70.3) |
22.4 (72.3) |
22.7 (72.9) |
22.5 (72.5) |
22.3 (72.1) |
22.3 (72.1) |
22.2 (72.0) |
21.9 (71.4) |
21.6 (70.9) |
20.3 (68.5) |
21.7 (71.1) |
| Average precipitation mm (inches) | 23.6 (0.93) |
34.6 (1.36) |
60.4 (2.38) |
120.2 (4.73) |
127.3 (5.01) |
109.4 (4.31) |
95.2 (3.75) |
119.7 (4.71) |
146.9 (5.78) |
135.6 (5.34) |
93.6 (3.69) |
39.1 (1.54) |
1,105.4 (43.52) |
| Average precipitation days (≥ 1.0 mm) | 3 | 4 | 6 | 10 | 13 | 11 | 10 | 12 | 12 | 14 | 9 | 4 | 105 |
| Average relative humidity (%) | 73 | 71 | 72 | 74 | 77 | 76 | 75 | 76 | 79 | 80 | 79 | 76 | 76 |
| Mean monthly sunshine hours | 235.6 | 203.3 | 186.0 | 156.0 | 148.8 | 162.0 | 201.5 | 179.8 | 138.0 | 142.6 | 162.0 | 192.2 | 2,107.8 |
| Mean daily sunshine hours | 7.6 | 7.2 | 6.0 | 5.2 | 4.8 | 5.4 | 6.5 | 5.8 | 4.6 | 4.6 | 5.4 | 6.2 | 5.8 |
| Source: Instituto de Hidrologia Meteorologia y Estudios Ambientales | |||||||||||||
See also
 In Spanish: El Carmen de Bolívar para niños
 | Aaron Henry |
 | T. R. M. Howard |
 | Jesse Jackson |


