Experiment, Georgia facts for kids
Quick facts for kids
Experiment, Georgia
|
|
|---|---|

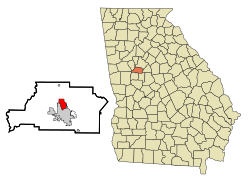
Location in Spalding County and the state of Georgia
|
|
| Country | United States |
| State | Georgia |
| County | Spalding |
| Area | |
| • Total | 2.98 sq mi (7.72 km2) |
| • Land | 2.97 sq mi (7.70 km2) |
| • Water | 0.01 sq mi (0.02 km2) |
| Elevation | 945 ft (288 m) |
| Population
(2020)
|
|
| • Total | 3,328 |
| • Density | 1,119.41/sq mi (432.17/km2) |
| Time zone | UTC-5 (Eastern (EST)) |
| • Summer (DST) | UTC-4 (EDT) |
| ZIP code |
30212
|
| Area code(s) | 770 |
| FIPS code | 13-28296 |
| GNIS feature ID | 0331680 |
Experiment is a small community in Spalding County, Georgia, in the United States. It's a place where people live but it's not officially a city or town with its own government. It's called an unincorporated community and also a census-designated place (CDP), which means the U.S. Census Bureau collects information about it. In 2020, about 3,328 people lived there.
Contents
History of Experiment
Experiment got its name from a special place located there called the University of Georgia Agricultural Experiment Station. This station is like a big farm where scientists study plants and farming to learn new things. It's a bit of an unusual name for a place!
In January 2023, a strong tornado hit Experiment. It caused a lot of damage and 18 people were hurt.
Geography and Location
Experiment is located in Georgia, just north of a city called Griffin. It's also about 30 miles (48 kilometers) south of Atlanta, which is a much bigger city. The community covers an area of about 3 square miles (7.7 square kilometers), and almost all of it is land.
Climate in Experiment
The weather in Experiment is typical for Georgia. It has warm summers and mild winters. Here's a look at the average temperatures and rainfall:
| Climate data for Experiment, Georgia, 1991–2020 normals, extremes 1900–2004 | |||||||||||||
|---|---|---|---|---|---|---|---|---|---|---|---|---|---|
| Month | Jan | Feb | Mar | Apr | May | Jun | Jul | Aug | Sep | Oct | Nov | Dec | Year |
| Record high °F (°C) | 79 (26) |
89 (32) |
88 (31) |
93 (34) |
97 (36) |
103 (39) |
104 (40) |
101 (38) |
103 (39) |
96 (36) |
86 (30) |
79 (26) |
104 (40) |
| Mean daily maximum °F (°C) | 55.6 (13.1) |
59.0 (15.0) |
66.8 (19.3) |
74.1 (23.4) |
81.2 (27.3) |
87.3 (30.7) |
89.8 (32.1) |
88.5 (31.4) |
83.9 (28.8) |
75.0 (23.9) |
65.8 (18.8) |
58.0 (14.4) |
73.7 (23.2) |
| Daily mean °F (°C) | 45.0 (7.2) |
47.7 (8.7) |
55.5 (13.1) |
62.1 (16.7) |
70.2 (21.2) |
76.6 (24.8) |
79.4 (26.3) |
78.2 (25.7) |
73.7 (23.2) |
63.6 (17.6) |
54.0 (12.2) |
47.2 (8.4) |
62.8 (17.1) |
| Mean daily minimum °F (°C) | 34.3 (1.3) |
36.5 (2.5) |
44.3 (6.8) |
50.1 (10.1) |
59.1 (15.1) |
66.0 (18.9) |
69.0 (20.6) |
68.0 (20.0) |
63.5 (17.5) |
52.2 (11.2) |
42.1 (5.6) |
36.4 (2.4) |
51.8 (11.0) |
| Record low °F (°C) | −8 (−22) |
5 (−15) |
11 (−12) |
25 (−4) |
35 (2) |
44 (7) |
51 (11) |
51 (11) |
35 (2) |
26 (−3) |
5 (−15) |
0 (−18) |
−8 (−22) |
| Average precipitation inches (mm) | 5.27 (134) |
4.32 (110) |
5.08 (129) |
4.04 (103) |
3.71 (94) |
4.91 (125) |
5.07 (129) |
5.08 (129) |
4.39 (112) |
3.31 (84) |
4.01 (102) |
5.00 (127) |
54.19 (1,378) |
| Average snowfall inches (cm) | 1.1 (2.8) |
0.0 (0.0) |
0.1 (0.25) |
0.0 (0.0) |
0.0 (0.0) |
0.0 (0.0) |
0.0 (0.0) |
0.0 (0.0) |
0.0 (0.0) |
0.0 (0.0) |
0.0 (0.0) |
0.0 (0.0) |
1.2 (3.05) |
| Average precipitation days (≥ 0.01 in) | 11.7 | 10.2 | 10.4 | 9.2 | 9.0 | 12.7 | 11.8 | 10.2 | 7.7 | 7.5 | 9.2 | 11.1 | 120.7 |
| Average snowy days (≥ 0.1 in) | 0.2 | 0.0 | 0.1 | 0.0 | 0.0 | 0.0 | 0.0 | 0.0 | 0.0 | 0.0 | 0.0 | 0.0 | 0.3 |
| Source 1: NOAA (snow/snow days 1981–2010) | |||||||||||||
| Source 2: National Weather Service | |||||||||||||
Population and People
The number of people living in Experiment has changed over the years. Here's how the population has grown and shrunk:
| Historical population | |||
|---|---|---|---|
| Census | Pop. | %± | |
| 1950 | 4,265 | — | |
| 1960 | 2,497 | −41.5% | |
| 1970 | 2,256 | −9.7% | |
| 1980 | 3,731 | 65.4% | |
| 1990 | 3,762 | 0.8% | |
| 2000 | 3,233 | −14.1% | |
| 2010 | 2,894 | −10.5% | |
| 2020 | 3,328 | 15.0% | |
| U.S. Decennial Census 1850-1870 1870-1880 1890-1910 1920-1930 1940 1950 1960 1970 1980 1990 2000 2010 2020 |
|||
Experiment was first counted as an "unincorporated place" in the 1950 U.S. Census. Later, in the 1980 U.S. Census, it became a "census-designated place" (CDP).
Population in 2020
According to the 2020 census, there were 3,328 people living in Experiment. The community is made up of people from different backgrounds. Most residents are African American or White, with smaller groups of other races and people of Hispanic or Latino origin.
In 2000, there were 3,233 people living in Experiment. About 35% of the homes had children under 18. The average age of people living there was 31 years old.
See also
 In Spanish: Experiment (Georgia) para niños
 | Selma Burke |
 | Pauline Powell Burns |
 | Frederick J. Brown |
 | Robert Blackburn |

