
First derivative test facts for kids
The first derivative test is a cool tool in calculus! It helps you find the highest and lowest points on a graph of a function. These special points are called local maxima (peaks) and local minima (valleys). This test also shows you where a function's graph is going up (increasing) or going down (decreasing).
What Are Critical Points and How to Find Them?
Think of a critical point as a special spot on a function's graph. At these points, the function's derivative (which tells you the slope of the graph) is either zero or undefined. When the derivative is zero, the graph is flat for a tiny moment, like at the very top of a hill or the bottom of a valley. If the derivative is undefined, it means the graph has a sharp corner or a break.
To find these critical points:
- Step 1: Find the first derivative of your function. This is like finding a new function that tells you the slope of the original one.
- Step 2: Set this first derivative equal to zero (
 ). Then, solve the equation to find the values of
  . These values are your critical numbers.
 - Step 3: Also, check if there are any values where the derivative is undefined. For example, if your derivative is a fraction, look for values that would make the bottom part (the denominator) equal to zero.
- Step 4: Once you have your critical values, plug them back into the original function. This will give you the
 values, so you have the full coordinates
  of your critical points.
Example: Finding Critical Points
Let's try an example with the function 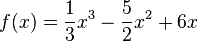 .
.
Step 1: Find the first derivative. 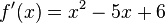
Step 2: Set the derivative to zero and solve for . 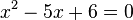 You can factor this equation:
 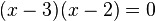 This gives us two critical values:
  and
and 
Step 3: In this example, the derivative is never undefined, so we only have these two critical numbers.
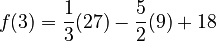
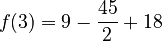
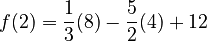
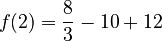
Step 4: Plug these values back into the original function  to find the coordinates. For :
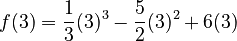
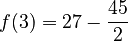
 So, one critical point is
  .
.
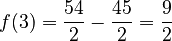
For : 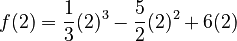
 So, the other critical point is
  .
.
Using the First Derivative Test to Find Maxima and Minima
Now that you have the critical points, the first derivative test helps you figure out if they are local maxima (peaks), local minima (valleys), or neither.
Here's how it works:
- Step 1: Place your critical values on a number line. These points divide the number line into different sections, or "intervals."
- Step 2: Pick a test number from each interval. This test number can be any value within that interval.
- Step 3: Plug each test number into the first derivative of the function (
 ).
).
- If the result is positive (
 ), it means the original function is increasing in that interval. The graph is going uphill.
 - If the result is negative (
 ), it means the original function is decreasing in that interval. The graph is going downhill.
- If the result is positive (
- Step 4: Look at the signs of the derivative in the intervals around each critical point:
- If the sign changes from positive to negative as you pass a critical point, that point is a local maximum. Think of going uphill then downhill – you're at a peak!
- If the sign changes from negative to positive as you pass a critical point, that point is a local minimum. Think of going downhill then uphill – you're in a valley!
- If the sign does not change (e.g., positive to positive, or negative to negative), then the critical point is neither a local maximum nor a local minimum. It might be a point where the graph flattens out for a moment but keeps going in the same direction.
This test is super useful in optimization problems. These are problems where you want to find the best possible outcome, like the maximum profit or the minimum cost.
