Good Hope, California facts for kids
Quick facts for kids
Good Hope, California
|
|
|---|---|

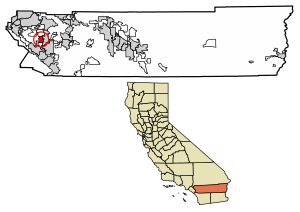
Location of Good Hope in Riverside County, California.
|
|
| Country | United States |
| State | California |
| County | Riverside |
| Area | |
| • Total | 11.233 sq mi (29.092 km2) |
| • Land | 11.233 sq mi (29.092 km2) |
| • Water | 0 sq mi (0 km2) 0% |
| Elevation | 1,624 ft (495 m) |
| Population
(2010)
|
|
| • Total | 9,192 |
| • Density | 818.30/sq mi (315.963/km2) |
| Time zone | UTC-8 (Pacific (PST)) |
| • Summer (DST) | UTC-7 (PDT) |
| ZIP code |
92570
|
| Area code(s) | 951 |
| GNIS feature ID | 2583026 |
Good Hope is a special kind of community in Riverside County, California. It's called a "census-designated place" because it's like a town but isn't officially set up as one.
Good Hope is located about 1,624 feet (495 m) above sea level. In 2010, a count of everyone living there showed that 9,192 people called Good Hope home.
Contents
Exploring Good Hope's Location
Good Hope is in California, a state on the west coast of the United States. It's part of Riverside County.
Land Area of Good Hope
The area of Good Hope is about 11.2 square miles (which is about 29.1 square kilometers). All of this area is land, meaning there are no large lakes or rivers within its borders.
Good Hope's Weather and Climate
The weather in Good Hope is known as a "dry-summer subtropical" climate. This is often called a "Mediterranean climate." It means the summers are usually hot and dry, while the winters are mild and a bit wetter.
Here's a quick look at the average temperatures and rainfall:
| Climate data for Good Hope, CA | |||||||||||||
|---|---|---|---|---|---|---|---|---|---|---|---|---|---|
| Month | Jan | Feb | Mar | Apr | May | Jun | Jul | Aug | Sep | Oct | Nov | Dec | Year |
| Mean daily maximum °F (°C) | 63 (17) |
67 (19) |
69 (21) |
74 (23) |
80 (27) |
87 (31) |
96 (36) |
96 (36) |
96 (36) |
87 (31) |
74 (23) |
66 (19) |
80 (27) |
| Mean daily minimum °F (°C) | 36 (2) |
37 (3) |
39 (4) |
43 (6) |
47 (8) |
50 (10) |
57 (14) |
57 (14) |
55 (13) |
46 (8) |
41 (5) |
37 (3) |
45 (7) |
| Average precipitation inches (mm) | 3.8 (97) |
0.9 (23) |
1.6 (41) |
0.9 (23) |
0.4 (10) |
0 (0) |
0.1 (2.5) |
0 (0) |
0.2 (5.1) |
0 (0) |
1.2 (30) |
1.5 (38) |
10.7 (270) |
| Source: Weatherbase | |||||||||||||
Who Lives in Good Hope?
| Historical population | |||
|---|---|---|---|
| Census | Pop. | %± | |
| U.S. Decennial Census | |||
In 2010, the population of Good Hope was 9,192 people. This means there were about 818 people living in each square mile.
Diversity in Good Hope
The people living in Good Hope come from many different backgrounds:
- About 45% of the people were White.
- About 7% were African American.
- About 1% were Native American.
- Less than 1% were Asian or Pacific Islander.
- About 42% were from other races.
- About 3% were from two or more races.
A large part of the population, nearly 80%, identified as Hispanic or Latino.
Households and Families
Most people in Good Hope live in homes with their families.
- In 2010, there were 2,103 households.
- More than half of these households (about 60%) had children under 18 living there.
- The average household had about 4.37 people.
- Most households were families, with an average family size of 4.60 people.
Age Groups in Good Hope
The community of Good Hope has people of all ages:
- About 35% of the population was under 18 years old.
- About 12% were young adults aged 18 to 24.
- About 26% were adults aged 25 to 44.
- About 20% were adults aged 45 to 64.
- About 8% were seniors aged 65 or older.
The average age in Good Hope was about 27.2 years old.
Homes in the Community
There were 2,370 housing units in Good Hope.
- About 60% of these homes were owned by the people living in them.
- About 40% of the homes were rented.
- Most people (about 59%) lived in homes they owned, while others (about 41%) lived in rented homes.
See also
 In Spanish: Good Hope (California) para niños
 | James B. Knighten |
 | Azellia White |
 | Willa Brown |


