Green Spring, Kentucky facts for kids
Quick facts for kids
Green Spring, Kentucky
|
|
|---|---|

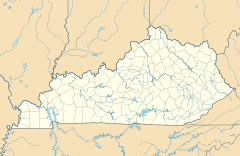
Location of Green Spring in Jefferson County, Kentucky
|
|
| Country | United States |
| State | Kentucky |
| County | Jefferson |
| Area | |
| • Total | 0.27 sq mi (0.69 km2) |
| • Land | 0.27 sq mi (0.69 km2) |
| • Water | 0.00 sq mi (0.00 km2) |
| Elevation | 607 ft (185 m) |
| Population
(2020)
|
|
| • Total | 711 |
| • Density | 2,662.92/sq mi (1,029.20/km2) |
| Time zone | UTC-5 (Eastern (EST)) |
| • Summer (DST) | UTC-4 (EDT) |
| ZIP Code |
40241
|
| FIPS code | 21-32986 |
| GNIS feature ID | 2403737 |
Green Spring is a small city in Jefferson County, Kentucky, United States. It is known as a "home rule-class city," which means it has the power to manage its own local affairs.
In 2020, about 711 people lived in Green Spring. The city was officially created by the state government in 1974.
Contents
Where is Green Spring Located?
Green Spring is found in the northern part of Jefferson County. To its north, you'll find the city of Prospect. On all other sides, it is surrounded by the larger area of Louisville and Jefferson County.
Major Roads Near Green Spring
Interstate 265, also called the Gene Snyder Freeway, forms the northern edge of the city. This highway helps people travel around the area. Downtown Louisville is about 11 miles (18 kilometers) to the southwest.
Size of Green Spring
According to the United States Census Bureau, Green Spring covers a total area of about 0.27 square miles (0.7 square kilometers). All of this area is land, with no water.
How Many People Live in Green Spring?
The number of people living in Green Spring has changed over the years. Here’s a quick look at the population counts from different censuses:
| Historical population | |||
|---|---|---|---|
| Census | Pop. | %± | |
| 1980 | 634 | — | |
| 1990 | 768 | 21.1% | |
| 2000 | 759 | −1.2% | |
| 2010 | 715 | −5.8% | |
| 2020 | 711 | −0.6% | |
| U.S. Decennial Census | |||
Population Details from 2000
In the year 2000, there were 759 people living in Green Spring. These people lived in 255 households, and 239 of these were families.
Most of the people in Green Spring were White (93.41%). There were also African American (3.43%) and Asian (2.37%) residents. A small number of people (0.79%) identified as being of two or more races. About 0.79% of the population was Hispanic or Latino.
Households and Families
In 2000, about 41.6% of the households had children under 18 living there. Most households (87.1%) were married couples living together. A smaller number (6.3%) were female householders without a husband present. About 5.9% were not families.
The average household had about 2.98 people, and the average family had about 3.08 people.
Age Groups in Green Spring
The population of Green Spring in 2000 was spread across different age groups:
- 27.5% were under 18 years old.
- 4.6% were between 18 and 24 years old.
- 21.3% were between 25 and 44 years old.
- 39.7% were between 45 and 64 years old.
- 6.9% were 65 years old or older.
The average age of people in Green Spring was 43 years.
Income in Green Spring
In 2000, the typical income for a household in Green Spring was $100,846. For families, the typical income was $101,499. Men generally earned more, with a median income of $72,000, compared to $36,563 for women.
The per capita income for the city was $37,458. This means that if the total income of the city was divided equally among everyone, each person would get this amount. Very few people in Green Spring (0.1%) were living below the poverty line in 2000.
See also
 In Spanish: Green Spring (Kentucky) para niños
 | Sharif Bey |
 | Hale Woodruff |
 | Richmond Barthé |
 | Purvis Young |


