Green Valley Farms, Texas facts for kids
Quick facts for kids
Green Valley Farms, Texas
|
|
|---|---|
 |
|
| Country | United States |
| State | Texas |
| County | Cameron |
| Area | |
| • Total | 4.0 sq mi (10.3 km2) |
| • Land | 3.9 sq mi (10.0 km2) |
| • Water | 0.1 sq mi (0.3 km2) |
| Elevation | 20 ft (6 m) |
| Population
(2020)
|
|
| • Total | 655 |
| • Density | 164.7/sq mi (63.6/km2) |
| Time zone | UTC-6 (Central (CST)) |
| • Summer (DST) | UTC-5 (CDT) |
| FIPS code | 48-30890 |
| GNIS feature ID | 1852710 |
Green Valley Farms is a small community in Cameron County, Texas, in the United States. It is a "census-designated place" (CDP). This means it's an area that the government defines for gathering statistics, but it doesn't have its own city government.
In 2020, 655 people lived in Green Valley Farms. This number was lower than in 2010, when 1,272 people lived there. Green Valley Farms is part of the larger Brownsville–Harlingen metropolitan area.
Contents
Location and Land Area
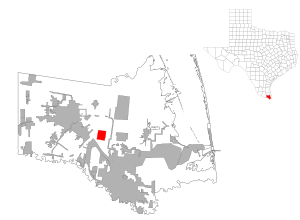
Green Valley Farms is located in the middle of Cameron County. You can find it at these coordinates: 26°7′10″N 97°33′53″W / 26.11944°N 97.56472°W. It is about 7 miles (11 km) east of San Benito. It is also about 18 miles (29 km) north of the center of Brownsville.
The United States Census Bureau says that Green Valley Farms covers a total area of about 4.0 square miles (10.3 square kilometers). Most of this area, about 3.9 square miles (10.0 square kilometers), is land. A small part, about 0.1 square miles (0.3 square kilometers), is water.
Population Information
Green Valley Farms was first counted as a census-designated place in the 2000 U.S. Census. The population numbers have changed over the years.
| Historical population | |||
|---|---|---|---|
| Census | Pop. | %± | |
| 2000 | 720 | — | |
| 2010 | 1,272 | 76.7% | |
| 2020 | 655 | −48.5% | |
| U.S. Decennial Census 1850–1900 1910 1920 1930 1940 1950 1960 1970 1980 1990 2000 2010 2020 |
|||
Who Lives in Green Valley Farms?
Most people in Green Valley Farms are of Hispanic or Latino background. In 2020, about 96.34% of the population was Hispanic or Latino. Other groups, like White people, Black or African American people, and Native American people, make up smaller parts of the population.
In 2000, the average household had about 4.5 people living in it. Many households had children under 18. The median age of people living there was 21 years old. This means half the people were younger than 21 and half were older.
Schools and Education
Students in Green Valley Farms attend schools in the Los Fresnos Consolidated Independent School District. This district provides public education for the community.
Also, the South Texas Independent School District runs special "magnet schools" that serve students from Green Valley Farms. These schools often focus on specific subjects like science or health.
See also
 In Spanish: Green Valley Farms para niños
 | Kyle Baker |
 | Joseph Yoakum |
 | Laura Wheeler Waring |
 | Henry Ossawa Tanner |

