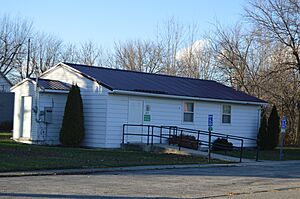
Haviland, Ohio facts for kids
Quick facts for kids
Haviland, Ohio
|
|
|---|---|
|
Village
|
|
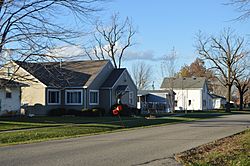
Houses on McKinley Street
|
|
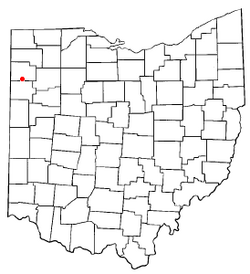
Location of Haviland, Ohio
|
|
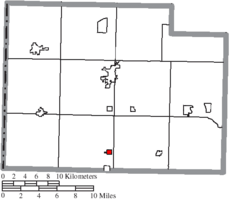
Location of Haviland in Paulding County
|
|
| Country | United States |
| State | Ohio |
| County | Paulding |
| Township | Blue Creek |
| Area | |
| • Total | 0.39 sq mi (1.02 km2) |
| • Land | 0.39 sq mi (1.02 km2) |
| • Water | 0.00 sq mi (0.00 km2) |
| Elevation | 735 ft (224 m) |
| Population
(2020)
|
|
| • Total | 160 |
| • Estimate
(2023)
|
162 |
| • Density | 407.12/sq mi (157.10/km2) |
| Time zone | UTC-5 (Eastern (EST)) |
| • Summer (DST) | UTC-4 (EDT) |
| ZIP code |
45851
|
| Area code(s) | 419 |
| FIPS code | 39-34552 |
| GNIS feature ID | 2398266 |
Haviland is a small village located in Paulding County, Ohio, United States. It is a quiet community where people live and work. In 2020, about 160 people called Haviland home. It is part of the larger state of Ohio.
Contents
Geography of Haviland
The village of Haviland covers a small area. According to the United States Census Bureau, its total area is about 0.39 square miles (1.02 square kilometers). This entire area is land. There are no large bodies of water like lakes or rivers within the village limits.
Population and People
| Historical population | |||
|---|---|---|---|
| Census | Pop. | %± | |
| 1900 | 186 | — | |
| 1910 | 233 | 25.3% | |
| 1920 | 270 | 15.9% | |
| 1930 | 202 | −25.2% | |
| 1940 | 210 | 4.0% | |
| 1950 | 235 | 11.9% | |
| 1960 | 235 | 0.0% | |
| 1970 | 231 | −1.7% | |
| 1980 | 219 | −5.2% | |
| 1990 | 210 | −4.1% | |
| 2000 | 180 | −14.3% | |
| 2010 | 215 | 19.4% | |
| 2020 | 160 | −25.6% | |
| 2023 (est.) | 162 | −24.7% | |
| U.S. Decennial Census | |||
How Many People Live Here?
The number of people living in Haviland has changed over the years. In 2010, the census counted 215 people living in the village. By 2020, the population was 160 people. This shows a decrease in the number of residents.
Who Lives in Haviland?
In 2010, there were 79 households in Haviland. A household means all the people living together in one home. Most of the people living in Haviland were White. A small percentage were from other racial backgrounds. About 5.6% of the population identified as Hispanic or Latino.
The average age of people in Haviland in 2010 was about 34.9 years old. This means that half the population was younger than 34.9, and half was older. About 26.5% of the residents were under 18 years old. This shows that many families with children lived in the village.
See also
 In Spanish: Haviland (Ohio) para niños
 | Madam C. J. Walker |
 | Janet Emerson Bashen |
 | Annie Turnbo Malone |
 | Maggie L. Walker |


