Hollowayville, Illinois facts for kids
Quick facts for kids
Hollowayville, Illinois
|
|
|---|---|

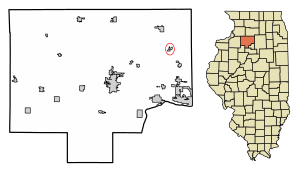
Location of Hollowayville in Bureau County, Illinois.
|
|

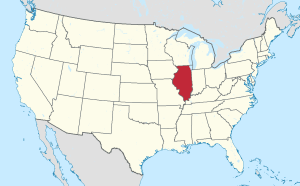
Location of Illinois in the United States
|
|
| Country | United States |
| State | Illinois |
| County | Bureau |
| Township | Selby |
| Area | |
| • Total | 0.05 sq mi (0.13 km2) |
| • Land | 0.05 sq mi (0.13 km2) |
| • Water | 0.00 sq mi (0.00 km2) 0% |
| Population
(2020)
|
|
| • Total | 36 |
| • Density | 734.69/sq mi (284.00/km2) |
| Time zone | UTC-6 (CST) |
| • Summer (DST) | UTC-5 (CDT) |
| ZIP Code(s) |
61356
|
| Area codes | 815 & 779 |
| FIPS code | 17-35671 |
| Wikimedia Commons | Hollowayville, Illinois |
Hollowayville is a small village located in Bureau County, Illinois, in the United States. In 2020, only 36 people lived there, making it a very tiny community! It's part of the wider Ottawa area.
Contents
A Look Back in Time
Just west of Hollowayville, you'll find St. John's Evangelical Lutheran Church. This church was started in 1849 by German immigrants who came to live in the area.
Hollowayville is one of the oldest villages in Bureau County. Long ago, it was a place where people mined for coal. Today, Hollowayville is known for having one of the lowest sales tax rates in the state of Illinois.
Where is Hollowayville?
Hollowayville is located at coordinates 41°21′54″N 89°17′41″W. This tells us its exact spot on a map.
The village is very small. It covers an area of about 0.05 square miles (0.13 square kilometers). All of this area is land, with no large bodies of water.
People in Hollowayville
| Historical population | |||
|---|---|---|---|
| Census | Pop. | %± | |
| 1880 | 111 | — | |
| 1900 | 207 | — | |
| 1910 | 196 | −5.3% | |
| 1920 | 107 | −45.4% | |
| 1930 | 104 | −2.8% | |
| 1940 | 112 | 7.7% | |
| 1950 | 89 | −20.5% | |
| 1960 | 96 | 7.9% | |
| 1970 | 94 | −2.1% | |
| 1980 | 92 | −2.1% | |
| 1990 | 37 | −59.8% | |
| 2000 | 90 | 143.2% | |
| 2010 | 84 | −6.7% | |
| 2020 | 36 | −57.1% | |
| U.S. Decennial Census | |||
The number of people living in Hollowayville has changed a lot over the years. In 1900, there were 207 people. By 2020, the population had become much smaller, with only 36 residents.
Who Lives Here?
In 2020, there were 36 people living in Hollowayville. These people made up 24 households and 24 families. A household is a group of people living together in one home.
Most of the people in the village were White (83.33%). There were also small numbers of Native American, Asian, and people from two or more races. No residents identified as Hispanic or Latino.
Age Groups
The people in Hollowayville come from different age groups. About 15.8% of the residents were under 18 years old. This means there are some kids and teenagers living there.
About 26.3% of the people were 65 years old or older. This shows that many older adults live in the village. The average age of people in Hollowayville was 45.8 years.
See also
 In Spanish: Hollowayville para niños
 | Valerie Thomas |
 | Frederick McKinley Jones |
 | George Edward Alcorn Jr. |
 | Thomas Mensah |

