Quick facts for kids {{{Name}}}
[[{{{Type}}} constituency]] |
[[Image:{{{Map1}}}Constituency.svg|120px|]]
[[Image:England{{{Map2}}}.svg|120px|]] |
{{{Name}}} shown within [[{{{Entity}}}]], and {{{Entity}}} shown within England |
Created: |
{{{Year}}} |
MP: |
{{{MP}}} |
Party: |
{{{Party}}} |
Type: |
House of Commons |
County: |
[[{{{County}}}]] |
EP constituency: |
[[{{{EP}}} (European Parliament constituency)|{{{EP}}}]] |
Kensington North was a parliamentary constituency centred on the Kensington district of west London. It returned one Member of Parliament (MP) to the House of Commons of the Parliament of the United Kingdom.
The constituency was created for the 1885 general election, and abolished for the February 1974 general election.
Boundaries
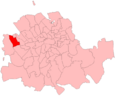
Kensington North in the Metropolitan area from 1885 to 1918
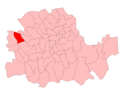
Kensington North in London from 1918 to 1950
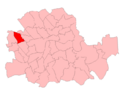
Kensington North in London from 1950 to 1974
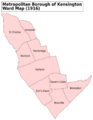
wards of Kensington Metropolitan Borough in 1916
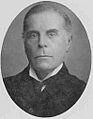
1918–1974: The Royal Borough of Kensington wards of Golborne, Norland, Pembridge, and St Charles.
Members of Parliament
Election results
Elections in the 1880s
Elections in the 1890s
Elections in the 1900s
Elections in the 1910s
Election in the 1920s
General election 1922: Kensington, North |
Party |
Candidate |
Votes |
% |
±% |
|
Unionist |
Percy George Gates |
12,328 |
53.1 |
-25.2 |
|
Labour |
William Joseph Jarrett |
6,225 |
26.8 |
+5.1 |
|
Liberal |
Charles William Hayward |
4,666 |
20.1 |
New |
Majority |
6,103 |
26.3 |
-30.3 |
Turnout |
42,328 |
54.9 |
+10.7 |
|
Unionist hold |
Swing |
-15.2 |
|
General election 1923: Kensington North |
Party |
Candidate |
Votes |
% |
±% |
|
Unionist |
Percy George Gates |
9,458 |
39.4 |
-13.7 |
|
Labour |
William Joseph Jarrett |
8,888 |
37.0 |
+10.2 |
|
Liberal |
Leonard Stein |
5,672 |
23.6 |
+3.5 |
Majority |
570 |
2.4 |
-23.9 |
Turnout |
43,050 |
55.8 |
+0.9 |
|
Unionist hold |
Swing |
-12.0 |
|
General election 1929: Kensington North |
Party |
Candidate |
Votes |
% |
±% |
|
Labour |
Fielding West |
19,701 |
48.4 |
+1.4 |
|
Unionist |
Percy George Gates |
15,511 |
38.1 |
-14.9 |
|
Liberal |
Frances Stewart |
5,516 |
13.5 |
New |
Majority |
4,190 |
10.3 |
N/A |
Turnout |
59,500 |
68.5 |
-1.1 |
|
Labour gain from Unionist |
Swing |
+8.1 |
|
Election in the 1930s
General election 1931: Kensington, North |
Party |
Candidate |
Votes |
% |
±% |
|
Conservative |
James Duncan |
27,860 |
63.7 |
+25.6 |
|
Labour |
Fielding West |
15,843 |
36.3 |
-12.1 |
Majority |
12,017 |
27.4 |
N/A |
Turnout |
60,821 |
71.9 |
+3.4 |
|
Conservative gain from Labour |
Swing |
+18.8 |
|
General election 1935: Kensington, North |
Party |
Candidate |
Votes |
% |
±% |
|
Conservative |
James Duncan |
18,907 |
53.2 |
-10.5 |
|
Labour |
Frank Carter |
15,309 |
43.1 |
+6.8 |
|
Liberal |
John Seymour Spon |
1,323 |
3.7 |
New |
Majority |
3,598 |
10.1 |
-17.3 |
Turnout |
58,691 |
60.6 |
-11.3 |
|
Conservative hold |
Swing |
-8.7 |
|
Election in the 1940s
General election 1945: Kensington, North |
Party |
Candidate |
Votes |
% |
±% |
|
Labour |
George Rogers |
16,838 |
56.6 |
+13.5 |
|
Conservative |
James Duncan |
10,699 |
36.0 |
-17.2 |
|
Liberal |
John Richard Colclough |
2,212 |
7.4 |
+3.7 |
Majority |
6,139 |
20.6 |
N/A |
Turnout |
42,365 |
70.2 |
+9.6 |
|
Labour gain from Conservative |
Swing |
+15.4 |
|
Elections in the 1950s
General election 1950: Kensington North |
Party |
Candidate |
Votes |
% |
±% |
|
Labour |
George Rogers |
21,615 |
50.65 |
|
|
Conservative |
Leonard Caplan |
17,991 |
42.15 |
|
|
Liberal |
Robert Rufus Carey Evans |
2,522 |
5.91 |
|
|
Communist |
M.J. Eyre |
551 |
1.29 |
New |
Majority |
3,624 |
8.50 |
|
Turnout |
54,480 |
78.34 |
|
|
Labour hold |
Swing |
|
|
General election 1951: Kensington, North |
Party |
Candidate |
Votes |
% |
±% |
|
Labour |
George Rogers |
22,686 |
52.99 |
|
|
Conservative |
Leonard Caplan |
18,543 |
43.31 |
|
|
Liberal |
Anthony Graeme Gamble |
1,583 |
3.70 |
|
Majority |
4,143 |
9.68 |
|
Turnout |
54,083 |
79.16 |
|
|
Labour hold |
Swing |
|
|
General election 1955: Kensington, North |
Party |
Candidate |
Votes |
% |
±% |
|
Labour |
George Rogers |
20,226 |
53.92 |
|
|
Conservative |
Robert Bulbrook |
17,283 |
46.08 |
|
Majority |
2,943 |
7.84 |
|
Turnout |
53,789 |
69.73 |
|
|
Labour hold |
Swing |
|
|
General election 1959: Kensington, North |
Party |
Candidate |
Votes |
% |
±% |
|
Labour |
George Rogers |
14,925 |
42.75 |
−11.17 |
|
Conservative |
Robert Bulbrook |
14,048 |
40.24 |
−5.84 |
|
Liberal |
Michael Louis Hydleman |
3,118 |
8.93 |
New |
|
Union Movement |
Oswald Mosley |
2,821 |
8.08 |
New |
Majority |
877 |
2.51 |
−5.33 |
Turnout |
34,912 |
67.83 |
−1.90 |
|
Labour hold |
Swing |
−2.7 |
|
Elections in the 1960s
General election 1964: Kensington North |
Party |
Candidate |
Votes |
% |
±% |
|
Labour |
George Rogers |
15,283 |
49.50 |
|
|
Conservative |
Andrew Bowden |
12,771 |
41.37 |
|
|
Liberal |
Yvonne C Richardson |
2,819 |
9.13 |
|
Majority |
2,512 |
8.13 |
|
Turnout |
30,873 |
61.32 |
|
|
Labour hold |
Swing |
|
|
General election 1966: Kensington North |
Party |
Candidate |
Votes |
% |
±% |
|
Labour |
George Rogers |
16,012 |
54.79 |
|
|
Conservative |
Leon Brittan |
10,749 |
36.78 |
|
|
Liberal |
Anthony Clive S Thomas |
2,462 |
8.42 |
|
Majority |
5,263 |
18.01 |
|
Turnout |
29,223 |
62.07 |
|
|
Labour hold |
Swing |
|
|
Election in the 1970s