King Edward Point facts for kids
Quick facts for kids
King Edward Point
|
|
|---|---|

King Edward Point
|
|

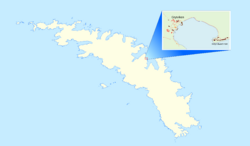
Location of King Edward Point and Grytviken in South Georgia
|
|
| Country | |
| Territory | South Georgia and the South Sandwich Islands |
| Operator | British Antarctic Survey |
| Established | 1950 |
| Population
(2018)
|
|
| • Summer | 22 |
| • Winter | 12 |
| Time zone | UTC−2 (GST) |
| UN/LOCODE | GS |
| Active times | All year-round |
| Status | Operational |
| Activities | Support sustainable fishing |
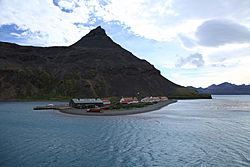
King Edward Point (often called KEP) is a special place on South Georgia island. It's a permanent research station run by the British Antarctic Survey. KEP is also the capital city of the British Overseas Territory of South Georgia and the South Sandwich Islands. You can find it on the northeastern coast of the island, in Cumberland East Bay. KEP is actually one of the smallest capital cities in the world! Only Ngerulmud in Palau has fewer people.
History of King Edward Point
The area around King Edward Point was first explored by the Swedish Antarctic Expedition. This happened between 1901 and 1904, led by Otto Nordenskiöld. The name "King Edward Point" was given around 1906. It was named after King Edward VII of the United Kingdom.
Since 1909, a British Magistrate has lived at King Edward Point. This person was in charge of managing the island. In 1925, the government of the United Kingdom built Discovery House. This was a special marine laboratory for the Discovery Investigations.
Research Station Activities
On January 1, 1950, the Falkland Islands Dependencies Survey took over the station. The station had people living and working there from 1952 until 1969. The British Antarctic Survey then kept a British presence at the station until 1982.
In April 1982, during a conflict known as the Falklands War, forces from Argentina took over South Georgia. They closed the station. However, British military forces quickly took back the area later that same month. From 1991, civilian Marine Officers were sent to King Edward Point. They helped with customs and fishing duties for the South Georgia Government.
On March 22, 2001, the British Antarctic Survey reopened the station. They did this for the Government of South Georgia and the South Sandwich Islands (GSGSSI). Most of the old buildings were replaced with new ones. Only Discovery House (built in 1925) and the Gaol (built in 1912) were kept.
Today, about 12 people from the British Antarctic Survey stay at the station during winter. This number goes up to around 22 in the summer. Two government officers also live at KEP, especially during the busy winter fishing season. Staff from the Museum at Grytviken also stay at KEP during the summer.
The station also serves an important political purpose. It helps to show that the United Kingdom still controls the territory. This is important because Argentina also claims ownership of the area.
The main work at the station is studying fish. This research helps the Government of South Georgia and South Sandwich Islands. It helps them manage fishing in a way that protects fish populations for the future. The station also provides support for the government officers working there.
Climate and Weather at King Edward Point
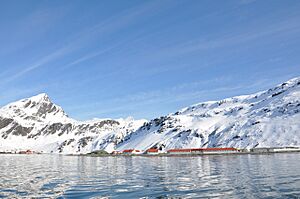
King Edward Point and nearby Grytviken have a tundra climate. This means they have long, cold winters and short, cool summers. The highest temperature ever recorded at Grytviken/King Edward Point was 28.8 degrees Celsius. This happened on March 10, 1922.
| Climate data for Grytviken/King Edward Point (normals and extremes 2006–2020) | |||||||||||||
|---|---|---|---|---|---|---|---|---|---|---|---|---|---|
| Month | Jan | Feb | Mar | Apr | May | Jun | Jul | Aug | Sep | Oct | Nov | Dec | Year |
| Record high °C (°F) | 23.0 (73.4) |
23.0 (73.4) |
21.6 (70.9) |
21.7 (71.1) |
17.1 (62.8) |
14.1 (57.4) |
14.9 (58.8) |
13.9 (57.0) |
16.0 (60.8) |
20.2 (68.4) |
20.4 (68.7) |
26.4 (79.5) |
26.4 (79.5) |
| Mean daily maximum °C (°F) | 10.0 (50.0) |
10.8 (51.4) |
9.4 (48.9) |
6.1 (43.0) |
3.9 (39.0) |
2.2 (36.0) |
1.7 (35.1) |
2.4 (36.3) |
4.5 (40.1) |
6.9 (44.4) |
8.9 (48.0) |
9.8 (49.6) |
6.4 (43.5) |
| Daily mean °C (°F) | 6.3 (43.3) |
6.9 (44.4) |
5.8 (42.4) |
3.2 (37.8) |
1.0 (33.8) |
−0.4 (31.3) |
−1.2 (29.8) |
−0.6 (30.9) |
1.1 (34.0) |
3.3 (37.9) |
5.0 (41.0) |
6.1 (43.0) |
3.0 (37.5) |
| Mean daily minimum °C (°F) | 2.6 (36.7) |
3.1 (37.6) |
2.2 (36.0) |
0.2 (32.4) |
−2.0 (28.4) |
−4.6 (23.7) |
−4.0 (24.8) |
−3.7 (25.3) |
−2.3 (27.9) |
−0.3 (31.5) |
1.0 (33.8) |
2.3 (36.1) |
−0.5 (31.2) |
| Record low °C (°F) | −2.5 (27.5) |
−3.0 (26.6) |
−4.0 (24.8) |
−7.0 (19.4) |
−10.0 (14.0) |
−11.2 (11.8) |
−15.1 (4.8) |
−13.0 (8.6) |
−11.0 (12.2) |
−9.5 (14.9) |
−5.0 (23.0) |
−4.0 (24.8) |
−15.1 (4.8) |
| Average precipitation mm (inches) | 92 (3.6) |
114 (4.5) |
136 (5.4) |
139 (5.5) |
137 (5.4) |
135 (5.3) |
149 (5.9) |
149 (5.9) |
92 (3.6) |
80 (3.1) |
93 (3.7) |
88 (3.5) |
1,394 (54.9) |
| Average precipitation days (≥ 0.1 mm) | 12 | 13 | 14 | 14 | 12 | 15 | 15 | 14 | 11 | 12 | 11 | 11 | 154 |
| Average relative humidity (%) | 72 | 69 | 69 | 70 | 74 | 75 | 74 | 73 | 72 | 70 | 69 | 71 | 72 |
| Mean monthly sunshine hours | 152 | 160 | 127 | 66 | 34 | 12 | 22 | 74 | 123 | 171 | 174 | 167 | 1,282 |
| Source 1: Meteomanz | |||||||||||||
| Source 2: Globalbioclimatics/Salvador Rivas-Martínez (precipitation 1901–1950) DMI/Danish Meteorology Institute (sun, humidity, and precipitation days 1931–1960) Météo Climat (extremes) | |||||||||||||
| Climate data for Grytviken/King Edward Point (normals and extremes 1901–1950, sunshine 1931–1960) | |||||||||||||
|---|---|---|---|---|---|---|---|---|---|---|---|---|---|
| Month | Jan | Feb | Mar | Apr | May | Jun | Jul | Aug | Sep | Oct | Nov | Dec | Year |
| Record high °C (°F) | 24.5 (76.1) |
26.5 (79.7) |
28.8 (83.8) |
19.1 (66.4) |
17.5 (63.5) |
14.0 (57.2) |
13.6 (56.5) |
13.2 (55.8) |
17.0 (62.6) |
20.0 (68.0) |
22.5 (72.5) |
21.5 (70.7) |
28.8 (83.8) |
| Mean daily maximum °C (°F) | 8.4 (47.1) |
9.1 (48.4) |
8.4 (47.1) |
5.6 (42.1) |
2.9 (37.2) |
0.9 (33.6) |
1.2 (34.2) |
1.5 (34.7) |
3.5 (38.3) |
5.4 (41.7) |
6.5 (43.7) |
7.5 (45.5) |
5.1 (41.2) |
| Daily mean °C (°F) | 4.6 (40.3) |
5.1 (41.2) |
4.4 (39.9) |
2.3 (36.1) |
0.0 (32.0) |
−1.6 (29.1) |
−1.5 (29.3) |
−1.8 (28.8) |
−0.1 (31.8) |
1.6 (34.9) |
2.7 (36.9) |
3.7 (38.7) |
1.6 (34.9) |
| Mean daily minimum °C (°F) | 1.4 (34.5) |
1.7 (35.1) |
1.0 (33.8) |
−0.8 (30.6) |
−3.1 (26.4) |
−4.6 (23.7) |
−4.7 (23.5) |
−4.9 (23.2) |
−3.3 (26.1) |
−1.8 (28.8) |
−0.5 (31.1) |
0.4 (32.7) |
−1.6 (29.1) |
| Record low °C (°F) | −4.1 (24.6) |
−3.7 (25.3) |
−6.3 (20.7) |
−9.8 (14.4) |
−11.4 (11.5) |
−14.6 (5.7) |
−15.2 (4.6) |
−19.2 (−2.6) |
−18.4 (−1.1) |
−11 (12) |
−6.4 (20.5) |
−5.4 (22.3) |
−19.2 (−2.6) |
| Average precipitation mm (inches) | 92 (3.6) |
114 (4.5) |
136 (5.4) |
139 (5.5) |
137 (5.4) |
135 (5.3) |
149 (5.9) |
149 (5.9) |
92 (3.6) |
80 (3.1) |
93 (3.7) |
88 (3.5) |
1,394 (54.9) |
| Average precipitation days (≥ 0.1 mm) | 12 | 13 | 14 | 14 | 12 | 15 | 15 | 14 | 11 | 12 | 11 | 11 | 154 |
| Average relative humidity (%) | 72 | 69 | 69 | 70 | 74 | 75 | 74 | 73 | 72 | 70 | 69 | 71 | 72 |
| Mean monthly sunshine hours | 152 | 160 | 127 | 66 | 34 | 12 | 22 | 74 | 123 | 171 | 174 | 167 | 1,282 |
| Source 1: Globalbioclimatics/Salvador Rivas-Martínez | |||||||||||||
| Source 2: DMI/Danish Meteorology Institute (sun, humidity, and precipitation days 1931–1960) | |||||||||||||


