Kirchbichl facts for kids
Quick facts for kids
Kirchbichl
|
||
|---|---|---|

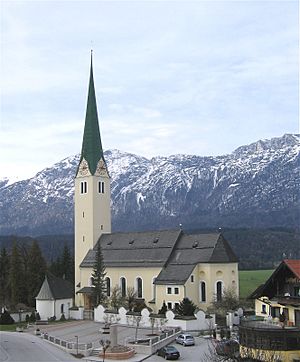
Kirchbichl parish church
|
||
|
||

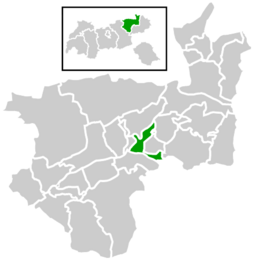
Location within Kufstein district
|
||
| Country | Austria | |
| State | Tyrol | |
| District | Kufstein | |
| Area | ||
| • Total | 14.97 km2 (5.78 sq mi) | |
| Elevation | 515 m (1,690 ft) | |
| Time zone | UTC+1 (CET) | |
| • Summer (DST) | UTC+2 (CEST) | |
| Postal code |
6322
|
|
| Area code | 05332 | |
| Vehicle registration | KU | |
| Website | www.kirchbichl.at | |
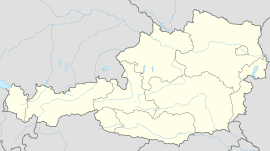
Kirchbichl is a town, also called a municipality, in Austria. It's located in the beautiful region of Tyrol, specifically in the Kufstein District. The town is about 10 kilometers (6 miles) south of Kufstein and 3 kilometers (1.8 miles) northeast of Wörgl.
Kirchbichl is made up of six smaller areas or parts. A big part of the town's money comes from the cement industry. This means they make cement, which is used to build things like roads and buildings.
What is the Weather Like in Kirchbichl?
The weather in Kirchbichl changes throughout the year, just like in many places. Here's a look at the average weather conditions based on data from 1971 to 2000.
| Climate data for Kirchbichl (1971–2000) | |||||||||||||
|---|---|---|---|---|---|---|---|---|---|---|---|---|---|
| Month | Jan | Feb | Mar | Apr | May | Jun | Jul | Aug | Sep | Oct | Nov | Dec | Year |
| Record high °C (°F) | 16.0 (60.8) |
18.2 (64.8) |
25.0 (77.0) |
26.8 (80.2) |
31.0 (87.8) |
35.4 (95.7) |
36.1 (97.0) |
33.8 (92.8) |
29.0 (84.2) |
27.0 (80.6) |
24.2 (75.6) |
19.0 (66.2) |
36.1 (97.0) |
| Mean daily maximum °C (°F) | 2.1 (35.8) |
4.6 (40.3) |
9.8 (49.6) |
13.9 (57.0) |
19.2 (66.6) |
21.2 (70.2) |
23.3 (73.9) |
23.2 (73.8) |
19.6 (67.3) |
14.6 (58.3) |
7.2 (45.0) |
2.7 (36.9) |
13.5 (56.3) |
| Daily mean °C (°F) | −2.2 (28.0) |
−0.5 (31.1) |
3.8 (38.8) |
7.8 (46.0) |
12.9 (55.2) |
15.5 (59.9) |
17.4 (63.3) |
17.1 (62.8) |
13.5 (56.3) |
8.7 (47.7) |
2.7 (36.9) |
−1.2 (29.8) |
8.0 (46.4) |
| Mean daily minimum °C (°F) | −5.4 (22.3) |
−4.1 (24.6) |
−0.5 (31.1) |
2.9 (37.2) |
7.3 (45.1) |
10.5 (50.9) |
12.4 (54.3) |
12.4 (54.3) |
9.2 (48.6) |
4.9 (40.8) |
−0.3 (31.5) |
−4.0 (24.8) |
3.8 (38.8) |
| Record low °C (°F) | −24.2 (−11.6) |
−19.8 (−3.6) |
−18.6 (−1.5) |
−6.8 (19.8) |
−4.3 (24.3) |
0.2 (32.4) |
3.8 (38.8) |
0.0 (32.0) |
−0.5 (31.1) |
−6.0 (21.2) |
−18.8 (−1.8) |
−20.2 (−4.4) |
−24.2 (−11.6) |
| Average precipitation mm (inches) | 73.9 (2.91) |
62.0 (2.44) |
76.3 (3.00) |
72.7 (2.86) |
95.7 (3.77) |
140.3 (5.52) |
158.0 (6.22) |
142.4 (5.61) |
90.8 (3.57) |
64.5 (2.54) |
81.0 (3.19) |
77.6 (3.06) |
1,135.2 (44.69) |
| Average snowfall cm (inches) | 25.5 (10.0) |
27.1 (10.7) |
17.3 (6.8) |
3.1 (1.2) |
0.0 (0.0) |
0.0 (0.0) |
0.0 (0.0) |
0.0 (0.0) |
0.0 (0.0) |
0.0 (0.0) |
11.7 (4.6) |
23.8 (9.4) |
108.5 (42.7) |
| Average precipitation days (≥ 1.0 mm) | 9.7 | 8.2 | 10.9 | 11.3 | 12.1 | 15.2 | 15.0 | 14.3 | 10.3 | 9.0 | 10.2 | 10.5 | 136.7 |
| Average relative humidity (%) (at 14:00) | 71.2 | 61.5 | 53.0 | 49.0 | 48.5 | 54.0 | 53.7 | 55.2 | 56.5 | 57.9 | 67.5 | 75.5 | 58.6 |
| Mean monthly sunshine hours | 78.6 | 104.1 | 135.5 | 147.8 | 190.7 | 169.9 | 206.0 | 206.1 | 163.1 | 143.2 | 83.4 | 67.4 | 1,695.8 |
| Percent possible sunshine | 32.4 | 40.0 | 41.5 | 41.2 | 45.2 | 39.4 | 47.4 | 51.8 | 48.6 | 47.4 | 33.3 | 29.3 | 41.5 |
| Source: Central Institute for Meteorology and Geodynamics | |||||||||||||
How Many People Live in Kirchbichl?
The number of people living in Kirchbichl has changed over many years. Here's a look at how the population has grown since 1869.
| Historical population | ||
|---|---|---|
| Year | Pop. | ±% |
| 1869 | 1,259 | — |
| 1880 | 1,330 | +5.6% |
| 1890 | 1,892 | +42.3% |
| 1900 | 2,510 | +32.7% |
| 1910 | 3,028 | +20.6% |
| 1923 | 3,126 | +3.2% |
| 1934 | 3,456 | +10.6% |
| 1939 | 3,549 | +2.7% |
| 1951 | 3,914 | +10.3% |
| 1961 | 4,064 | +3.8% |
| 1971 | 4,689 | +15.4% |
| 1981 | 4,784 | +2.0% |
| 1991 | 4,960 | +3.7% |
| 2001 | 5,060 | +2.0% |
| 2013 | 5,359 | +5.9% |
See also
 In Spanish: Kirchbichl para niños
 | Janet Taylor Pickett |
 | Synthia Saint James |
 | Howardena Pindell |
 | Faith Ringgold |


