La Bolt, South Dakota facts for kids
Quick facts for kids
La Bolt, South Dakota
|
|
|---|---|

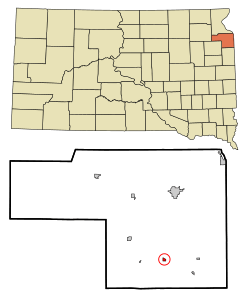
Location in Grant County and the state of South Dakota
|
|
| Country | United States |
| State | South Dakota |
| County | Grant |
| Incorporated | 1901 |
| Area | |
| • Total | 0.24 sq mi (0.62 km2) |
| • Land | 0.24 sq mi (0.62 km2) |
| • Water | 0.00 sq mi (0.00 km2) |
| Elevation | 1,371 ft (418 m) |
| Population
(2020)
|
|
| • Total | 66 |
| • Density | 277.31/sq mi (107.03/km2) |
| Time zone | UTC-6 (Central (CST)) |
| • Summer (DST) | UTC-5 (CDT) |
| ZIP code |
57246
|
| Area code(s) | 605 |
| FIPS code | 46-34540 |
| GNIS feature ID | 1267447 |
La Bolt is a small town located in Grant County, South Dakota, in the United States. It's a quiet place with a friendly community. In 2020, about 66 people lived there. The town was named after Alfred Labolt, one of the first people to settle in the area.
Town Geography
La Bolt is a very small town. According to official measurements, it covers an area of about 0.62 square kilometers (or 0.24 square miles). All of this area is land, meaning there are no lakes or large rivers within the town limits.
Town Population
The number of people living in La Bolt has changed over the years. Here's a look at the population from different census counts:
| Historical population | |||
|---|---|---|---|
| Census | Pop. | %± | |
| 1920 | 142 | — | |
| 1930 | 126 | −11.3% | |
| 1940 | 127 | 0.8% | |
| 1950 | 164 | 29.1% | |
| 1960 | 125 | −23.8% | |
| 1970 | 90 | −28.0% | |
| 1980 | 94 | 4.4% | |
| 1990 | 91 | −3.2% | |
| 2000 | 86 | −5.5% | |
| 2010 | 68 | −20.9% | |
| 2020 | 66 | −2.9% | |
| U.S. Decennial Census | |||
Population in 2010
In 2010, the census counted 68 people living in La Bolt. These people lived in 33 different homes, and 21 of these were families. The town had about 109 people per square kilometer (or 283 people per square mile). There were 37 housing units, which means 37 places where people could live.
Most of the people in La Bolt in 2010 were White (97.1%). A small number were Native American (1.5%), and 1.5% were from two or more different backgrounds.
About 27.3% of the homes had children under 18 living there. More than half (54.5%) were married couples living together. A small number of homes had a female head of household without a husband (6.1%) or a male head of household without a wife (3.0%). About 36.4% of all homes were made up of individuals living alone.
The average age of people in La Bolt in 2010 was 49.3 years old.
- 20.6% of residents were under 18.
- 2.9% were between 18 and 24.
- 14.8% were between 25 and 44.
- 47.1% were between 45 and 64.
- 14.7% were 65 years or older.
When it came to gender, 55.9% of the population was male, and 44.1% was female.
See also
 In Spanish: La Bolt para niños
 | John T. Biggers |
 | Thomas Blackshear |
 | Mark Bradford |
 | Beverly Buchanan |

