La Concordia, Ecuador facts for kids
Quick facts for kids
La Concordia
|
|
|---|---|
|
City
|
|
| Country | Ecuador |
| Province | Santo Domingo de los Tsáchilas |
| Canton | La Concordia |
| Created | November 15, 1955 |
| Area | |
| • City | 9.21 km2 (3.56 sq mi) |
| Elevation | 217 m (712 ft) |
| Population
(2022 census)
|
|
| • City | 35,474 |
| • Density | 3,851.7/km2 (9,976/sq mi) |
| Demonym(s) | Concordense |
| Area code(s) | (+593) 02 |
| Climate | Am |
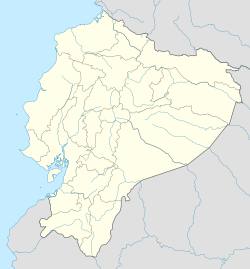
La Concordia is a city in Ecuador. It is the main city of La Concordia Canton, which is part of the Santo Domingo de los Tsáchilas Province. The city is located in the northern coastal area of Ecuador. It sits on a wide, flat plain about 217 meters (712 feet) above sea level. La Concordia has a warm, rainy tropical climate, with an average temperature of 25 °C (77 °F).
Climate in La Concordia
Even though La Concordia is very close to the equator, its climate is a bit different from what you might expect. Usually, places right on the equator have a tropical rainforest climate (Af), meaning it rains a lot all year.
However, La Concordia has a tropical monsoon climate (Am). This is because of something called the Humboldt Current. This cold ocean current travels north along the coast. When it reaches its northernmost point from July to November, it reduces the amount of rainfall in La Concordia. This creates a drier season during those months, even though the city is in the tropics.
| Climate data for La Concordia, elevation 300 m (980 ft), (1971–2000) | |||||||||||||
|---|---|---|---|---|---|---|---|---|---|---|---|---|---|
| Month | Jan | Feb | Mar | Apr | May | Jun | Jul | Aug | Sep | Oct | Nov | Dec | Year |
| Mean daily maximum °C (°F) | 28.7 (83.7) |
29.3 (84.7) |
29.7 (85.5) |
29.8 (85.6) |
29.0 (84.2) |
27.6 (81.7) |
27.3 (81.1) |
27.4 (81.3) |
27.4 (81.3) |
27.4 (81.3) |
27.0 (80.6) |
27.7 (81.9) |
28.2 (82.7) |
| Mean daily minimum °C (°F) | 21.2 (70.2) |
21.0 (69.8) |
21.1 (70.0) |
21.3 (70.3) |
21.1 (70.0) |
20.4 (68.7) |
19.5 (67.1) |
19.2 (66.6) |
19.0 (66.2) |
19.7 (67.5) |
19.0 (66.2) |
20.0 (68.0) |
20.2 (68.4) |
| Average precipitation mm (inches) | 457.0 (17.99) |
478.0 (18.82) |
639.0 (25.16) |
553.0 (21.77) |
316.0 (12.44) |
206.0 (8.11) |
82.0 (3.23) |
54.0 (2.13) |
73.0 (2.87) |
57.0 (2.24) |
42.0 (1.65) |
172.0 (6.77) |
3,129 (123.18) |
| Average relative humidity (%) | 90 | 88 | 87 | 88 | 89 | 90 | 89 | 89 | 90 | 90 | 88 | 88 | 89 |
| Source: FAO | |||||||||||||
See also
 In Spanish: La Concordia (Ecuador) para niños
 | Roy Wilkins |
 | John Lewis |
 | Linda Carol Brown |


