Lake Barrington, Illinois facts for kids
Quick facts for kids
Lake Barrington, Illinois
|
|||
|---|---|---|---|
|
|||

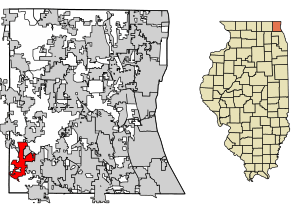
Location of Lake Barrington in Lake County, Illinois.
|
|||

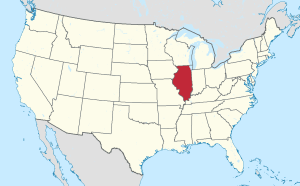
Location of Illinois in the United States
|
|||
| Country | United States | ||
| State | Illinois | ||
| County | Lake | ||
| Townships | Cuba, Wauconda | ||
| Area | |||
| • Total | 6.07 sq mi (15.71 km2) | ||
| • Land | 5.74 sq mi (14.86 km2) | ||
| • Water | 0.33 sq mi (0.86 km2) | ||
| Elevation | 781 ft (238 m) | ||
| Population
(2020)
|
|||
| • Total | 5,100 | ||
| • Density | 889.12/sq mi (343.29/km2) | ||
| Time zone | UTC-6 (CST) | ||
| • Summer (DST) | UTC-5 (CDT) | ||
| ZIP Code(s) |
60010
|
||
| Area codes | 847 & 224 | ||
| FIPS code | 17-40884 | ||
Lake Barrington is a friendly village located in Lake County, Illinois, in the United States. In 2020, about 5,100 people called this village home.
Contents
Where is Lake Barrington?
Lake Barrington is found at coordinates 42°12′45″N 88°10′05″W / 42.21250°N 88.16806°W. It is also right next to Lake Barrington itself, which used to be called Indian Lake. You can find this lake at 42°12′54″N 88°08′49″W / 42.21500°N 88.14694°W.
In 2010, the village covered a total area of about 6.167 square miles (15.97 square kilometers). Most of this area, about 5.86 square miles (15.18 square kilometers), is land. The rest, about 0.307 square miles (0.79 square kilometers), is water.
Who Lives in Lake Barrington?
This section looks at how the number of people living in Lake Barrington has changed over the years. It also shows the different groups of people who make up the village.
Population Growth Over Time
The village of Lake Barrington has grown quite a bit since 1960. Here's how the population has changed:
| Historical population | |||
|---|---|---|---|
| Census | Pop. | %± | |
| 1960 | 172 | — | |
| 1970 | 347 | 101.7% | |
| 1980 | 2,320 | 568.6% | |
| 1990 | 3,855 | 66.2% | |
| 2000 | 4,757 | 23.4% | |
| 2010 | 4,973 | 4.5% | |
| 2020 | 5,100 | 2.6% | |
| U.S. Decennial Census 2010 2020 |
|||
People of Lake Barrington in 2020
The table below shows the different racial and ethnic groups living in Lake Barrington in 2020. The US Census counts Hispanic/Latino people as an ethnic group, separate from racial categories. This means a Hispanic person can be of any race.
| Race / Ethnicity (NH = Non-Hispanic) | Pop 2000 | Pop 2010 | Pop 2020 | % 2000 | % 2010 | % 2020 |
|---|---|---|---|---|---|---|
| White alone (NH) | 4,589 | 4,652 | 4,473 | 96.47% | 93.55% | 87.71% |
| Black or African American alone (NH) | 20 | 36 | 31 | 0.42% | 0.72% | 0.61% |
| Native American or Alaska Native alone (NH) | 9 | 4 | 4 | 0.19% | 0.08% | 0.08% |
| Asian alone (NH) | 51 | 125 | 234 | 1.07% | 2.51% | 4.59% |
| Pacific Islander alone (NH) | 3 | 0 | 0 | 0.06% | 0.00% | 0.00% |
| Other race alone (NH) | 6 | 3 | 14 | 0.13% | 0.06% | 0.27% |
| Mixed race or Multiracial (NH) | 32 | 39 | 161 | 0.67% | 0.78% | 3.16% |
| Hispanic or Latino (any race) | 47 | 114 | 183 | 0.99% | 2.29% | 3.59% |
| Total | 4,757 | 4,973 | 5,100 | 100.00% | 100.00% | 100.00% |
See also
 In Spanish: Lake Barrington (Illinois) para niños
 | Aaron Henry |
 | T. R. M. Howard |
 | Jesse Jackson |


