Lawson, Arkansas facts for kids
Quick facts for kids
Lawson, Arkansas
|
|
|---|---|
| Country | United States |
| State | Arkansas |
| County | Union |
| Elevation | 213 ft (65 m) |
| Population
(2020)
|
|
| • Total | 260 |
| Time zone | UTC-6 (Central (CST)) |
| • Summer (DST) | UTC-5 (CDT) |
| ZIP code |
71750
|
| Area code(s) | 870 |
| GNIS feature ID | 2805659 |
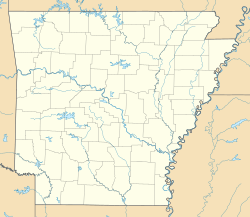
Lawson is a small community in Union County, Arkansas, in the United States. It's called a "census-designated place" (CDP). This means it's an area the government counts for population, even though it's not an official town or city.
Lawson was started by a person named Lawson Smith, who lived from 1813 to 1899. You can find Lawson on Arkansas Highway 129. It is about 10.5 miles (16.9 km) east of a bigger city called El Dorado. Lawson has its own post office with the ZIP code 71750. In the year 2020, the census counted 260 people living in Lawson.
Learning in Lawson: Schools and Education
Students in Lawson attend schools that are part of the El Dorado School District. This district runs El Dorado High School, where older students go.
A long time ago, in 1978, the school districts for Lawson and another community called Urbana joined together. They became part of the El Dorado School District. This made the school system bigger and helped more students.
Who Lives in Lawson: Population Facts
The United States government counts how many people live in different places every ten years. This is called a census.
| Historical population | |||
|---|---|---|---|
| Census | Pop. | %± | |
| 2020 | 260 | — | |
| U.S. Decennial Census 2020 |
|||
Lawson's Population in 2020
The 2020 census showed us more details about the people living in Lawson. This table helps us understand the different groups of people.
| Race / Ethnicity | Pop 2020 | % 2020 |
|---|---|---|
| White alone (NH) | 233 | 89.62% |
| Black or African American alone (NH) | 3 | 1.15% |
| Native American or Alaska Native alone (NH) | 0 | 0.00% |
| Asian alone (NH) | 1 | 0.38% |
| Pacific Islander alone (NH) | 2 | 0.77% |
| Some Other Race alone (NH) | 1 | 0.38% |
| Mixed Race/Multi-Racial (NH) | 13 | 8.03% |
| Hispanic or Latino (any race) | 5 | 5.00% |
| Total | 260 | 100.00% |
 | Precious Adams |
 | Lauren Anderson |
 | Janet Collins |


