Lewistown, Maryland facts for kids
Quick facts for kids
Lewistown
|
|
|---|---|
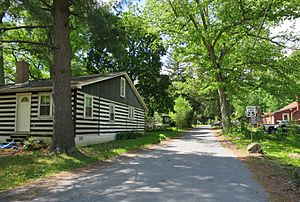
House in Lewistown
|
|
| Country | |
| State | |
| County | |
| Area | |
| • Total | 0.65 sq mi (1.68 km2) |
| • Land | 0.64 sq mi (1.66 km2) |
| • Water | 0.01 sq mi (0.02 km2) |
| Elevation | 427 ft (130 m) |
| Population
(2020)
|
|
| • Total | 458 |
| • Density | 715.63/sq mi (276.41/km2) |
| Time zone | UTC-5 (Eastern (EST)) |
| • Summer (DST) | UTC-4 (EDT) |
| FIPS code | 24-46650 |
| GNIS feature ID | 2806299 |
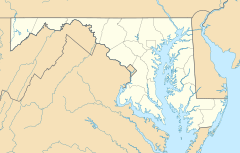
Lewistown is a small community in Frederick County, Maryland, in the United States. It is known as a census designated place, which means it's a specific area the government tracks for population numbers. Lewistown was founded in 1841.
The community has its own school, Lewistown Elementary. It is part of the Frederick County Public Schools system. There has been a school in Lewistown since the 1800s! In 2020, about 458 people lived here.
Contents
A Look Back in Time
Lewistown's Firefighters
The Lewistown Volunteer Fire Company started in 1970. This was a big deal because the community bought the first diesel fire engine in Frederick County! Today, the fire department has six different vehicles. These include fire engines, a tanker, a brush truck for wildfires, a utility vehicle, and an ambulance.
The fire station is run by volunteers from the community. It also has two paid employees from the county.
A Moment in History
On June 23, 1863, an important event happened here. General John F. Reynolds' I Corps, a group of soldiers, marched through Lewistown. They were on their way to Gettysburg. They were chasing the Confederate army during the American Civil War.
Who Lives in Lewistown?
Lewistown first appeared as a census-designated place in the 2020 Census. At that time, its population was 458 people.
Lewistown's Population in 2020
The table below shows the different groups of people living in Lewistown in 2020. This information comes from the U.S. Census.
| Race / Ethnicity | Pop 2020 | % 2020 |
|---|---|---|
| White alone (NH) | 396 | 86.46% |
| Black or African American alone (NH) | 11 | 2.40% |
| Native American or Alaska Native alone (NH) | 0 | 0.00% |
| Asian alone (NH) | 2 | 0.44% |
| Pacific Islander alone (NH) | 1 | 0.22% |
| Some Other Race alone (NH) | 0 | 0.00% |
| Mixed Race/Multi-Racial (NH) | 15 | 3.28% |
| Hispanic or Latino (any race) | 33 | 7.21% |
| Total | 458 | 100.00% |
Note: The US Census counts Hispanic/Latino people as an ethnic group. This means they are listed separately from racial categories. People who are Hispanic/Latino can be of any race.
 | Ernest Everett Just |
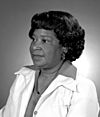 | Mary Jackson |
 | Emmett Chappelle |
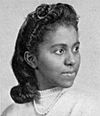 | Marie Maynard Daly |


