Little Ice Age facts for kids
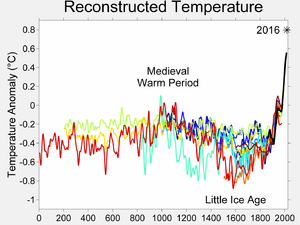
The Little Ice Age (LIA) was a time when Earth's climate became cooler after a warmer period called the Medieval Warm Period. It wasn't a true ice age, but a period of colder temperatures and more glaciers.
Scientists who study climate (called climatologists) and historians don't fully agree on when the Little Ice Age started or ended. Some think it began around the 1500s and lasted until the mid-1800s. It's generally agreed that there were three very cold periods, or "minima." One started around 1650, another around 1770, and the last one around 1850. These very cold times were separated by short periods of slight warming. At first, people thought the Little Ice Age happened all over the world. Now, scientists are not so sure if it affected every part of the globe in the same way.
Contents
Why Did the Little Ice Age Happen?
Scientists have a few ideas about what might have caused the Little Ice Age. It was likely a mix of different natural events.
Less Sun Activity
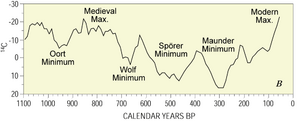
During a part of the Little Ice Age, from 1645 to 1715, there was a long period when the sun was less active. This is known as the Maunder Minimum. During this time, very few sunspots were seen on the sun. Sunspots are dark spots on the sun's surface that show its activity.
Scientists haven't fully proven how low sunspot activity directly causes cooler temperatures on Earth. However, the Maunder Minimum happened at the same time as one of the coldest parts of the Little Ice Age. This suggests there might be a connection. Another time of low sun activity, called the Spörer Minimum, also happened near the start of the Little Ice Age. Scientists can also look at levels of special atoms like carbon-14 and beryllium-10 to learn about past solar activity.
More Volcano Eruptions
The Little Ice Age also saw more volcanoes erupting around the world. When a volcano erupts, it can shoot huge amounts of ash and tiny particles high into the atmosphere. This ash cloud can spread across the entire Earth.
When the ash cloud is in the sky, it blocks some of the sun's rays from reaching Earth's surface. This can cause the whole planet to cool down. This cooling effect can last for up to two years after a big eruption.
Changes in Ocean Currents
Another idea is that the "great ocean conveyor belt" slowed down or even stopped. This conveyor belt is also known as Thermohaline circulation. It's like a giant global current that moves warm and cold water around the oceans. For example, the Gulf Stream brings warm water to Europe.
Scientists think this ocean current might have been interrupted. This could have happened if a lot of fresh water was added to the North Atlantic Ocean. This fresh water might have come from a period of warming before the Little Ice Age, which could have melted more ice. Some scientists are concerned that a similar slowing of this ocean current could happen again because of global warming.
When Did the Little Ice Age End?
Around the year 1850, Earth's climate started to warm up again. This warming marked the end of the Little Ice Age. Some people believe that Earth's climate is still naturally recovering from this cold period. They think that human activities are not the main reason for the temperature changes we see today. However, most scientists do not agree with this idea.
- IPCC on Was there a Little Ice Age and a Medieval Warm Period?
Images for kids
-
The last written records of the Norse people in Greenland are from a 1408 wedding at Hvalsey Church.
-
The Reverend Robert Walker Skating on Duddingston Loch, painted in the 1790s.
-
The Hunters in the Snow by Pieter Brueghel the Elder, 1565. This painting shows a very cold winter scene.
See also
 In Spanish: Pequeña Edad de Hielo para niños
 | Dorothy Vaughan |
 | Charles Henry Turner |
 | Hildrus Poindexter |
 | Henry Cecil McBay |


