
Map coloring facts for kids


Map coloring is a cool idea that means two different things, depending on if you're talking about maps you see every day or a puzzle in math.
When we talk about map coloring in geography or mapmaking, it's about using different colors to show areas on a map. For example, maps often use different colors to show different countries or states. This helps you easily see where one area ends and another begins. Maps can also use colors to show other information, like how high the land is (its altitude) or how many people live in different places.
In mathematics, map coloring is a fun challenge! It's about figuring out the smallest number of colors you need to color a map so that no two areas that touch each other have the same color. Imagine a map of different countries. If two countries share a border, they must be different colors. If they only meet at a single point, they can be the same color. This mathematical puzzle is super interesting and has led to some famous ideas, like the Four color theorem.
Contents
What is Map Coloring?
Map coloring is a way to make maps easier to understand and also a type of puzzle in math. It helps us organize information visually.
Coloring Maps for Geography
When you look at a map, you often see different colors. These colors aren't just for decoration! They help us quickly see different features or areas.
- Showing Countries or States: A world map might use a different color for each country. This makes it easy to spot borders and tell countries apart. The same goes for maps of a country showing its different states or provinces.
- Displaying Data: Colors can also show information like how tall mountains are, how much rain an area gets, or how many people live in a city. For example, a map might use green for low areas and brown for high mountains.
- Making Maps Clear: The main goal is to make the map clear and easy to read. If two areas that are next to each other had the same color, it would be hard to see where one ends and the other begins.
The Math Puzzle of Map Coloring
In math, map coloring is a problem where you try to use the fewest possible colors to color any map. The rule is simple: if two areas share a border, they must have different colors. If they only touch at a corner, they can be the same color.
- The Four Color Theorem: One of the most famous results from this puzzle is the Four color theorem. This theorem says that you only ever need four colors to color any map drawn on a flat surface (like a piece of paper) so that no two touching regions have the same color. This idea was first thought of in 1852, but it took over 100 years to prove it!
- Why is it Important? This math problem might seem like just a game, but it has real-world uses. It helps with things like scheduling, designing computer chips, and even planning cell phone networks. It's all about making sure different things that need to be separate (like signals or tasks) don't interfere with each other.
How Map Coloring Works
Let's look at how map coloring is used in both geography and mathematics.
Coloring for Visual Clarity
In mapmaking, choosing colors is an important job. Mapmakers pick colors that make sense and are easy for people to understand.
- Natural Colors: Often, colors are chosen to represent what they show. For example, blue is used for water, green for forests, and brown for land or mountains.
- Contrast: Colors are chosen so that areas next to each other stand out. This helps you quickly see the borders between different regions, like states or countries.
- Data Visualization: When showing data, mapmakers might use a range of colors, from light to dark, to show different amounts. For example, light blue for low rainfall and dark blue for heavy rainfall.
The Challenge of Minimal Colors
The mathematical side of map coloring is all about efficiency. Can we always use a small number of colors?
- Finding the Minimum: For any given map, mathematicians try to find the absolute smallest number of colors needed. This is called the "chromatic number" of the map.
- Complex Maps: Some maps can be very complex, with many regions touching each other. Figuring out the minimum number of colors for these maps can be a real brain-teaser!
- Computer Help: The Four Color Theorem was one of the first major math theorems to be proven with the help of computers. It was too complex for humans to check every single case by hand.
Images for kids
-
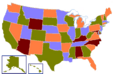
A map of the United States using colors to show political divisions using the four color theorem.

